Appearance
Workspace
What this page covers: the Workspace at route /workspace, which holds seven tabs in this order: Chat, Workflow, Agents, Autonomous, Spend, Learning and Logs. For each tab it explains the purpose, the controls, the common tasks and the API call behind it.
Prerequisites / permissions: you must be signed in with at least the read permission to open every tab and to ask questions in Chat. Running a plan, starting most agents and changing most autonomous settings needs the write permission. Starting the Guardian agent, changing the self-healing mode and clearing logs need the admin role. The permission summary lists each action. Account roles are explained in Account and access.
Screenshots show sample data. Your numbers, integration names and timestamps will differ. For the HTTP details behind each tab, see Agents and workflows API and the API overview.
Open the Workspace
Select Workspace in the left sidebar, or go to /workspace. The page title is Agent Workspace. The Chat tab opens first. To open another tab directly, add a query string such as /workspace?tab=spend. The accepted values are chat, workflow, agents, autonomous, spend, learning and logs. Any other value falls back to Chat.
Four older paths now land here: /chat, /orchestration, /admin/agents and /logs all redirect to /workspace and always show the Chat tab, even when the old page was the agent list or the logs. The older /autonomous path does not come here. It redirects to /alerts. The Alerts page links back to the Autonomous tab with /workspace?tab=autonomous.
On a phone-sized screen (narrower than 640 pixels) the Workflow, Agents, Autonomous and Logs tabs show a message that the view is designed for desktop. Chat, Spend and Learning work on small screens.
Chat
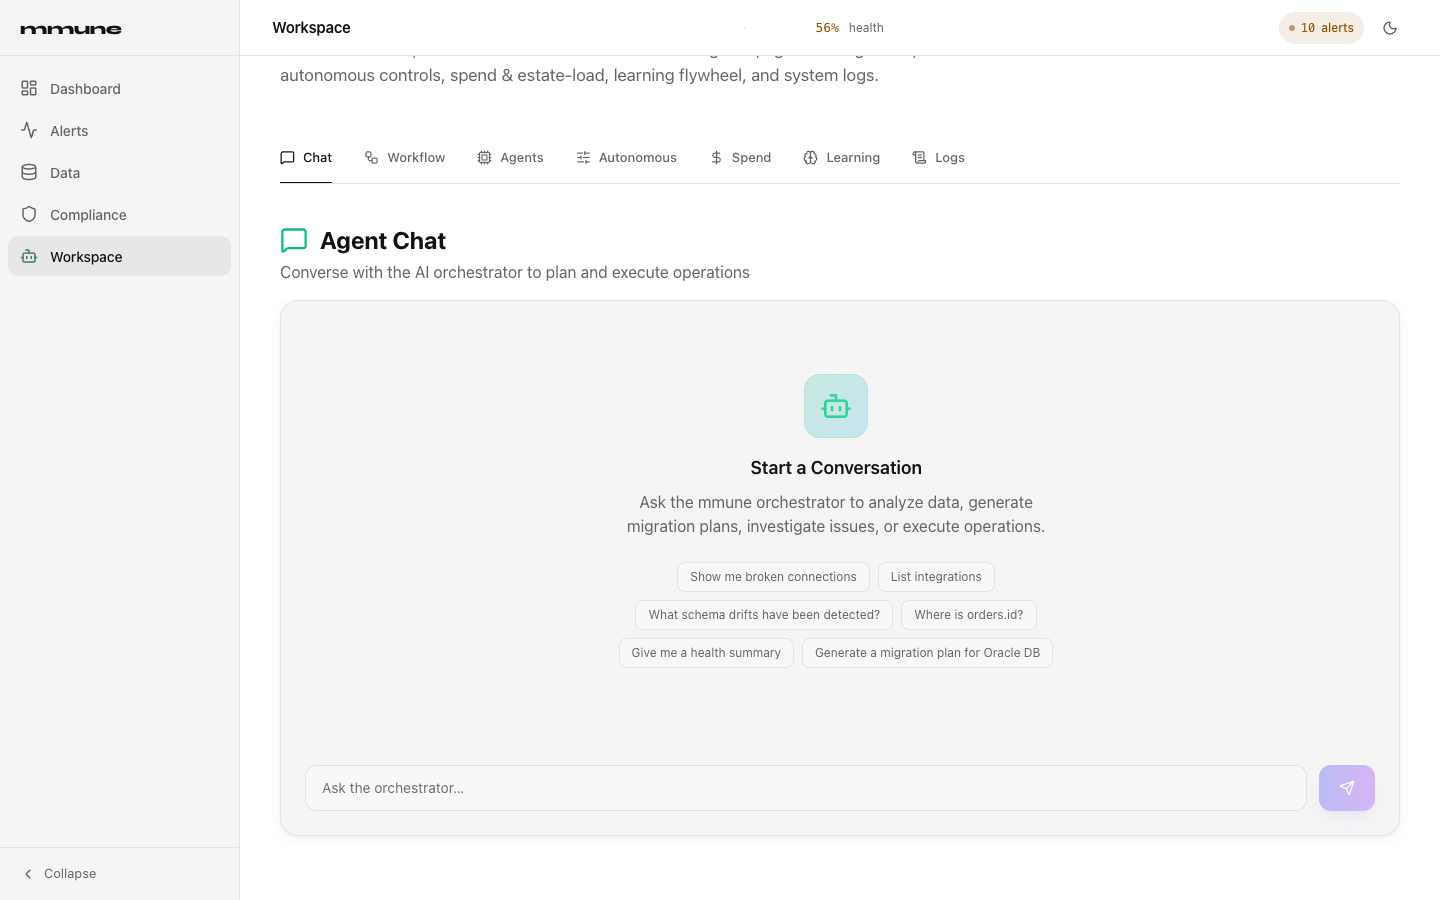
Purpose. Ask questions about your estate in plain language and get answers built from live mmune data: integrations, drift, lineage, health and compliance. Answers can include small tables and buttons that open the screen that owns the data. The same box can also draft an execution plan.
The conversation is kept while you move between pages. It is cleared by a hard refresh or by New conversation.
Controls
| Control | What it does |
|---|---|
| Suggestion chips | Six chips appear on an empty chat. Clicking one fills the input box without sending it. The six are: Show me broken connections, List integrations, What schema drifts have been detected?, Where is orders.id?, Give me a health summary and Generate a migration plan for Oracle DB. |
| Input box | Placeholder Ask the orchestrator…. Press Enter to send. It is disabled while an answer is in progress. |
| Send button | The paper plane icon to the right of the input. Disabled when the box is empty. |
| New conversation | Appears after the first message. Clears the whole conversation. |
| Tool chips | Small pills above an answer that name the data tools mmune used, for example Get Health Summary. An amber pill that starts with Action: means a tool that changes state was run. |
| Table blocks | Structured results rendered as a titled table inside the answer. |
| Console link buttons | Buttons under an answer that take you to the screen that holds the data, for example the Lineage tab of Data Explorer or the Alerts page. |
| Execute | On an Execution Plan card. Not available yet. See Plans in chat. |
How answers are produced
mmune tries a fast path first. If your question matches a known pattern, a read-only data tool answers directly with no AI model involved. The patterns cover broken connections, integration lists, drift reports, overall health, lineage, change impact, compliance posture, compliance findings and column lookups such as orders.id. Anything else goes to the AI model, which chooses which data tools to call and then writes an answer. Follow-up questions use up to the last 20 text messages as context.
The read-only data tools look up a column, list integrations, list broken connections, report drift, summarize health, trace lineage, assess the impact of a change, and report compliance posture and compliance findings.
Four further tools can change state: they start a duplicate scan, start an Estate Advisor scan, run a watchdog check now, and draft an orchestration plan. They exist only when the server runs with MMUNE_READ_ONLY=false, they run only for a user with the write permission, and each run is recorded in the audit log. Drafting an orchestration plan never runs it. With the default MMUNE_READ_ONLY=true the chat is strictly read-only.
Two situations produce a fixed reply instead of an answer. If no AI model is configured, the reply says No AI model is configured and lists console links so you can look at the data yourself. If a configured model is unreachable, the reply says it is temporarily unavailable. Questions about revenue, sales figures, profit, earnings or pricing, and about weather, stock price or news, get a short explanation that they are outside what mmune tracks.
Example prompts
| Prompt | What you get |
|---|---|
Show me broken connections | A list of integrations the connection monitor and watchdog consider broken, with a link to the Alerts page. |
Give me a health summary | Integration counts by state, broken connections and drift findings. |
What schema drifts have been detected? | Drift findings such as field renames, removals and type changes. |
Where is orders.id? | The semantic mapping rows for that column: vendor, source table and field, concept, category and confidence. |
What breaks if I change CRM_DB | The downstream lineage nodes affected by a change to that system, database or table, with a link that opens the lineage graph focused on it. Replace CRM_DB with a name from your own estate. |
Do we have any compliance findings? | Unprotected PII or PHI columns from the latest scan, with sensitivity and suggested remediation. |
What is our HIPAA posture? | Automated posture per framework (GDPR, HIPAA, SOC2, PCI-DSS). This is monitoring of observable controls, not a certification audit. |
Plans in chat
A message that asks for a plan or a migration produces an Execution Plan card. Drafting a plan needs a configured AI provider.
Execute on the chat plan card is not available yet. There is no second approval screen in Chat. To review and run a plan, use the Workflow tab instead.
Common tasks
- Check overall health: open Chat and click
Give me a health summary, then press Enter. - Find where a column is mapped: type
Where is orders.id?with your own table and column, then press Enter. Click a console link button to open the Semantic tab in Data Explorer. - Find what a change would touch: type
What breaks if I change <SYSTEM_NAME>and press Enter. Click the link button under the answer to see the affected nodes on the lineage graph. - Draft a plan: type
Generate a migration plan for <DATABASE>and press Enter. Read each step on the plan card. To run a plan, use the Workflow tab. - Start fresh: click New conversation.
API equivalent
POST /api/v1/analysis/chat/stream is the call the tab makes. It returns server-sent events with the frame types meta (tools used and whether the fast or slow path answered), delta (answer text), block (a table), done (console links) and error. POST /api/v1/analysis/chat returns the same content as one JSON object. Both take project_id, question and an optional history list of role and content pairs, and both need only the read permission. Plan drafting is POST /api/v1/orchestration/plan with goal and project_id, also read. Starting a plan is POST /api/v1/orchestration/execute and needs write.
Workflow
Purpose. Turn a goal written in plain words into a step-by-step plan, review it, approve it, then watch it run and download the results. Nothing runs until you approve.
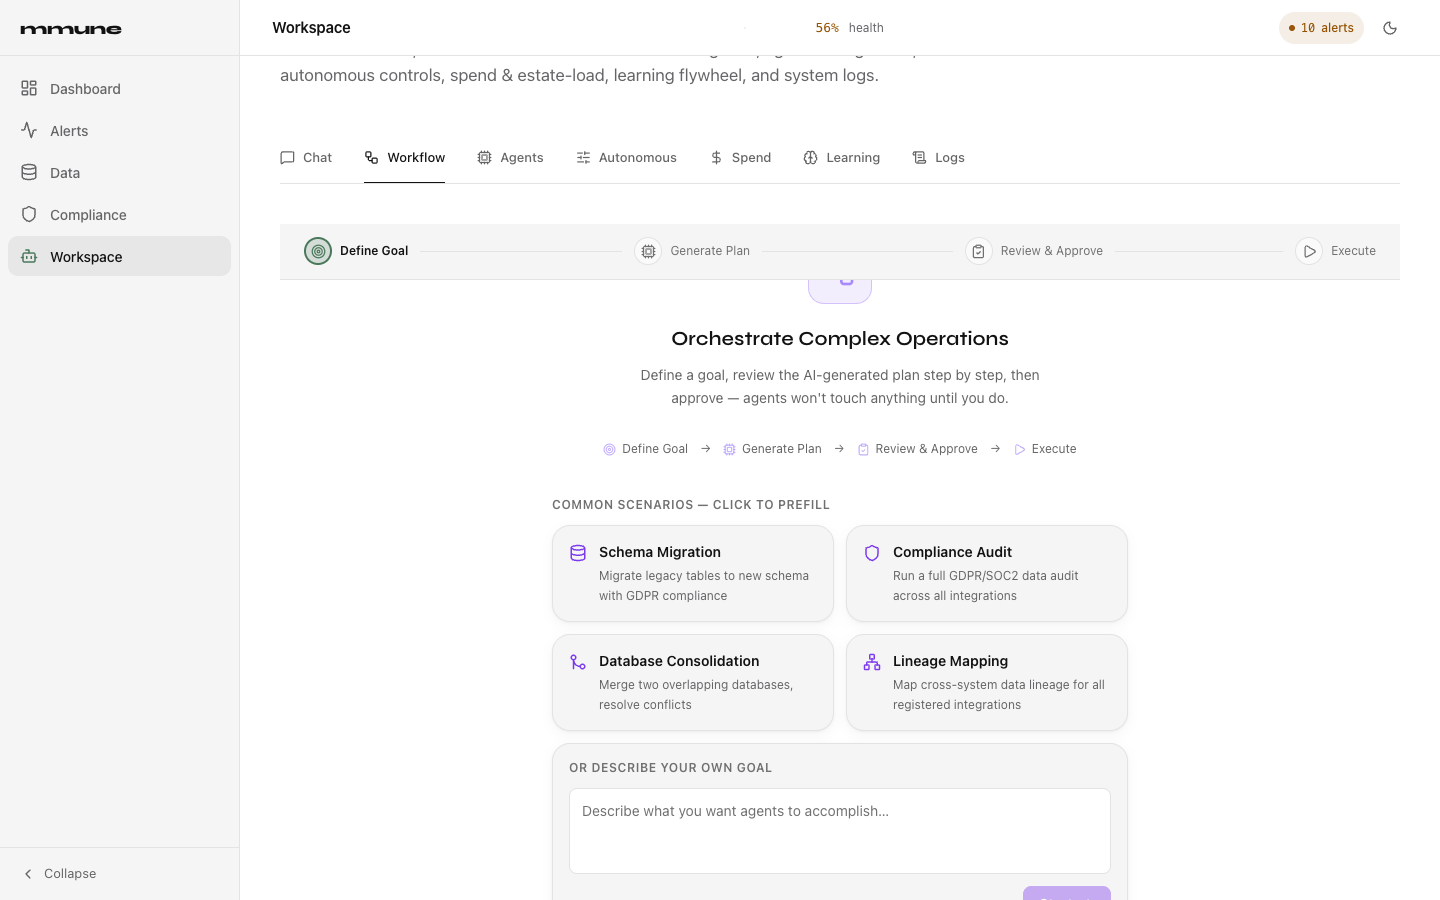
A progress bar across the top shows the four stages: Define Goal, Generate Plan, Review & Approve and Execute.
Controls
| Control | What it does |
|---|---|
| Scenario cards | Four cards under Common scenarios — click to prefill: Schema Migration (Migrate legacy tables to new schema with GDPR compliance), Compliance Audit (Run a full GDPR/SOC2 data audit across all integrations), Database Consolidation (Merge two overlapping databases, resolve conflicts) and Lineage Mapping (Map cross-system data lineage for all registered integrations). Clicking one copies its sentence into the goal box. |
| Own goal box and Start | Under Or describe your own goal. Start moves your text into the goal panel. |
| Goal panel | Titled Define Your Goal, marked Step 1 of 4. A text area with a character counter and a Generate Plan button, which is disabled while the box is empty. |
| Plan list | After planning, the left rail lists each step with its number, an agent label (discovery, analysis, mapping or security) and a description. |
| Plan Summary | The main area shows the step count. A plan with more than six steps adds the warning Complex plan — review each step carefully. |
| Approve & Execute | Sits under the label Human approval required and the text Agents will not execute until you approve this plan. Starts the run. |
| Log stream | During a run, a pane named orchestrator-engine.log shows progress lines and a Step X of Y counter. Each step in the left rail gets a running, done or failed icon. |
| Download Artifacts | After a successful run. Saves one JSON file named orchestration-artifacts-<EXECUTION_ID>-<DATE>.json. |
| Generated Artifacts | An accordion with one entry per step. Each entry shows that step's JSON result and a Download This Artifact button. |
What the planner can use
The planner may use only four agents, each with one action: discovery (scan_network), analysis (analyze_schema), mapping (generate_mapping) and security (scan_database). Steps declare which earlier steps they depend on, and steps whose dependencies are met run at the same time. If you have ingested reference documents through the RAG interface, the planner reads relevant passages before it writes the plan. A plan with no usable steps is reported as an error instead of an empty success.
mmune is read-only by default. While MMUNE_READ_ONLY is true, any step whose action name contains apply, execute, write, remediate, heal, delete, migrate or restore is not run. It is recorded with the status blocked_read_only and a reason. This means a Schema Migration goal produces a plan you can review, but its write steps are blocked in a default deployment. Generating a plan also needs a configured AI provider. Without one, planning fails with HTTP 503 and a message that lists the provider settings.
Common tasks
- Open the Workflow tab and click a scenario card, or type your own goal in the lower box and click Start.
- Edit the goal text if needed and click Generate Plan. Wait for the planning screen to finish.
- Read every step in the left rail and the Plan Summary. Pay attention to the complexity warning.
- Click Approve & Execute to run the plan. Watch the log stream and the step icons.
- When the run completes, open the entries under Generated Artifacts to inspect each result, then click Download Artifacts to keep them.
- If the run fails, the log shows
CRITICAL FAILURE IN PIPELINEand the step that failed shows a failed icon. The failing step's message is in the log lines.
API equivalent
Planning is POST /api/v1/orchestration/plan (body goal, project_id, optional session_id and context_data). Running is POST /api/v1/orchestration/execute (body plan, project_id), which needs write and returns an execution_id. Progress is GET /api/v1/orchestration/status/{execution_id}?cursor=N, which returns status (RUNNING, COMPLETED or FAILED), new logs, a next_cursor, and results. The download is GET /api/v1/orchestration/artifacts/{execution_id}/download?format=json and works only for completed runs.
The API also lists workflow templates with GET /api/v1/workflows/templates, which this tab does not use. Reference documents for the planner are managed through the API with POST /api/v1/rag/ingest, POST /api/v1/rag/ingest/file, GET /api/v1/rag/documents and DELETE /api/v1/rag/documents/{document_name}.
Agents
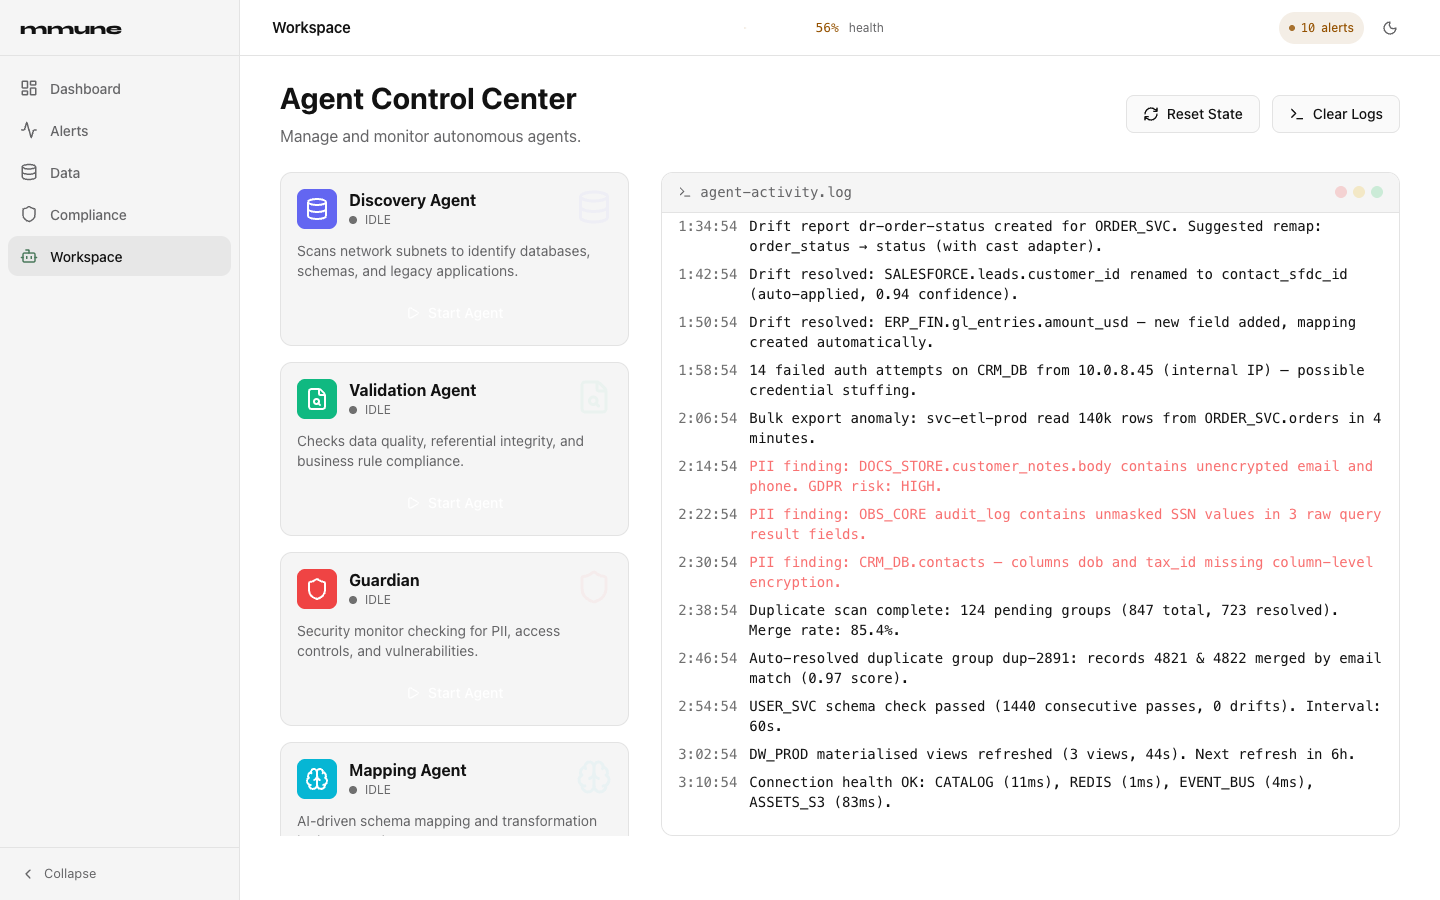
Purpose. The Agent Control Center lists the six agents you can start from the browser, shows a live activity feed, and lets you clear it.
Controls
Each agent card shows a name, a one-line description, a status (IDLE, RUNNING, COMPLETED or FAILED) and a Start Agent button. The button reads Running... and is disabled while that agent runs. The header has two buttons. Reset State sets every card back to IDLE in your browser only. Clear Logs deletes the stored agent logs for everyone and needs the admin role. The right pane, agent-activity.log, shows the latest 100 entries and adds new ones about once per second. Red text marks errors and green text marks success.
The agent roster
| Agent | Card description | What Start Agent does |
|---|---|---|
| Discovery Agent | Scans network subnets to identify databases, schemas, and legacy applications. | Starts a discovery scan with no target, which scans the machine that runs mmune. Findings are added to the discovered-integration inventory. Needs write. |
| Validation Agent | Checks data quality, referential integrity, and business rule compliance. | Not available yet in a production installation. |
| Guardian | Security monitor checking for PII, access controls, and vulnerabilities. | Starts a security scan with target all. It analyses the table and column names and types that mmune already stored during introspection, not live cell values. Results feed the Compliance page. Needs the admin role. |
| Mapping Agent | AI-driven schema mapping and transformation logic generation. | Opens the Mapping Studio tab in Data Explorer. The card status stays IDLE. |
| Analysis Agent | Deep code analysis and dependency mapping. | Opens a dialog titled Analysis Agent where you type questions and read answers. The card status stays IDLE. |
| Orchestrator | Manages complex modernization workflows. | Opens the Workspace Chat tab. Use the Workflow tab for orchestration. The card status stays IDLE. |
Common tasks
- Run a discovery scan: open the Agents tab, click Start Agent on Discovery Agent, and watch
agent-activity.loguntil the card showsCOMPLETED. - Run a security scan: sign in as an administrator, click Start Agent on Guardian, and wait for
COMPLETED. Then open the Compliance page to read the results. - Ask the Analysis Agent a question: click Start Agent on Analysis Agent, type in the dialog and send.
- Empty the feed: click Clear Logs (administrators only). Reset State only resets the cards.
API equivalent
Discovery: POST /api/v1/discovery/scan (optional target and ports), then GET /api/v1/discovery/status/{scan_id}?cursor=N. Guardian: POST /api/v1/guardian/scan (optional target), then GET /api/v1/guardian/status/{job_id}?cursor=N. Analysis dialog: POST /api/v1/analysis/chat. Feed: GET /api/v1/logs.
Run history is not shown in this tab, but the API serves it: GET /api/v1/agents/executions (filters agent_type, status, project_id, user_id, days with a default of 7, limit with a default of 100 and a maximum of 1000, and offset), GET /api/v1/agents/executions/{execution_id} and GET /api/v1/agents/statistics, which returns totals, success rate and average duration.
Autonomous
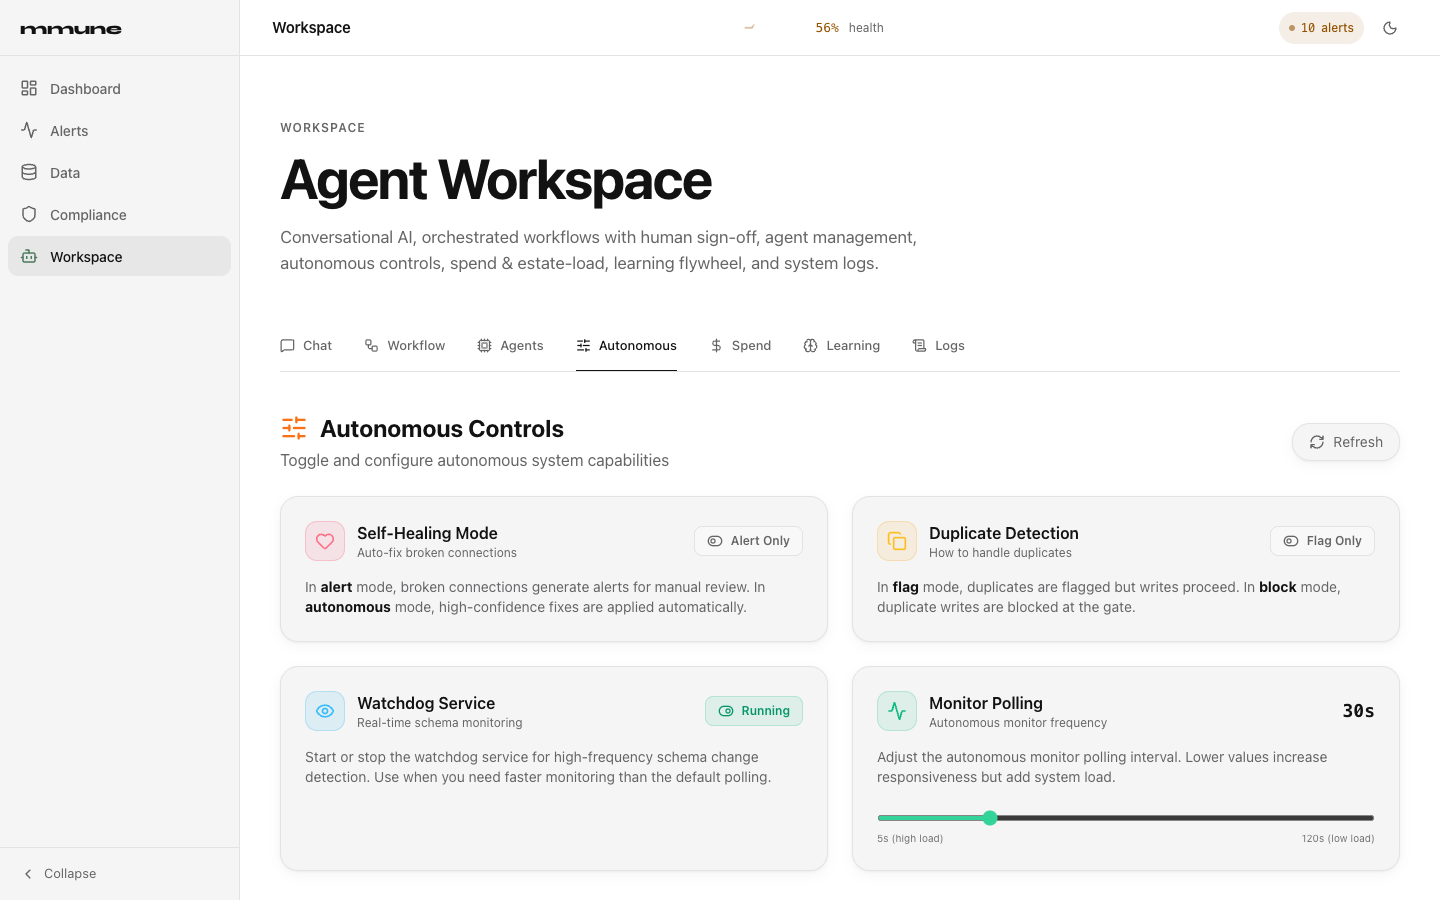
Purpose. Four switches and sliders that decide how much mmune does on its own: how it handles broken field mappings, how strict the duplicate check is, whether the watchdog runs, and how often it polls.
Controls
| Card | Control | Values |
|---|---|---|
| Self-Healing Mode | Toggle button | Alert Only or Autonomous. |
| Self-Healing Mode | Auto-Apply Confidence Threshold slider | Shown only in Autonomous mode. Runs from 50% (aggressive) to 100% (conservative) in 5% steps. The default is 90%. |
| Duplicate Detection | Toggle button | Flag Only or Block. |
| Watchdog Service | Toggle button | Running or Stopped. |
| Monitor Polling | Slider | 5 to 120 seconds in 5 second steps. Lower values react faster and add load. |
The Refresh button reloads all four values. A failed change shows its error text under the card.
Healing mode: alert or autonomous
A broken connection often means a field was renamed or removed, so an existing mapping points at something that is gone. Healing asks the semantic layer for a replacement field and a confidence score. In alert mode, which is the default, mmune only shows the suggestion and raises an alert for a person to review. In autonomous mode, mmune applies the top suggestion by itself when its confidence is at or above the threshold. Applying means updating mmune's own semantic mapping store. It does not change anything in your source systems. Autonomous healing is also held back while the affected integration is under containment for an open incident, so the suggestion is proposed and not applied.
The mode and threshold are saved and survive a restart. The starting values come from the HEALING_MODE and HEALING_AUTO_APPLY_THRESHOLD environment variables, and the built-in defaults are alert and 0.9. Only an administrator can change them.
Duplicate mode
Duplicate mode is advice that mmune gives to a data pipeline. A pipeline calls POST /api/v1/duplicates/validate-before-write before it writes a record. In flag mode the answer is always allowed and says whether a duplicate was found. In block mode the answer is allowed: false when a duplicate is found. mmune does not intercept writes itself. The setting is held in server memory, so it returns to the DUPLICATE_MODE environment value (default flag) after a restart.
Common tasks
- Turn on autonomous healing: sign in as an administrator, open Autonomous, click the Self-Healing Mode toggle until it reads
Autonomous, then drag the threshold slider. Raise it toward 100% if you want fewer automatic changes. - Return to review-only healing: click the toggle until it reads
Alert Only. - Pause monitoring: click the Watchdog Service toggle so it reads
Stopped. Click it again to restart. - Poll less often: drag the Monitor Polling slider to a larger number of seconds.
API equivalent
Healing: GET /api/v1/healing/config and PUT /api/v1/healing/config with mode (alert or autonomous) and auto_apply_threshold (0 to 1). The PUT needs the admin role. Suggestions come from POST /api/v1/healing/suggest-remapping and a person can apply one with POST /api/v1/healing/apply-suggestion, both write. Duplicates: GET and PUT /api/v1/duplicates/config with mode (flag or block). Watchdog: GET /api/v1/watchdog/status, POST /api/v1/watchdog/start and POST /api/v1/watchdog/stop. Polling: GET and POST /api/v1/monitoring/poll-interval; the POST body field is interval in seconds, and it returns 404 when AutoPilot is not running.
Spend
Purpose. See what AI usage costs and how much query load mmune puts on your monitored systems, measured against any budget caps.
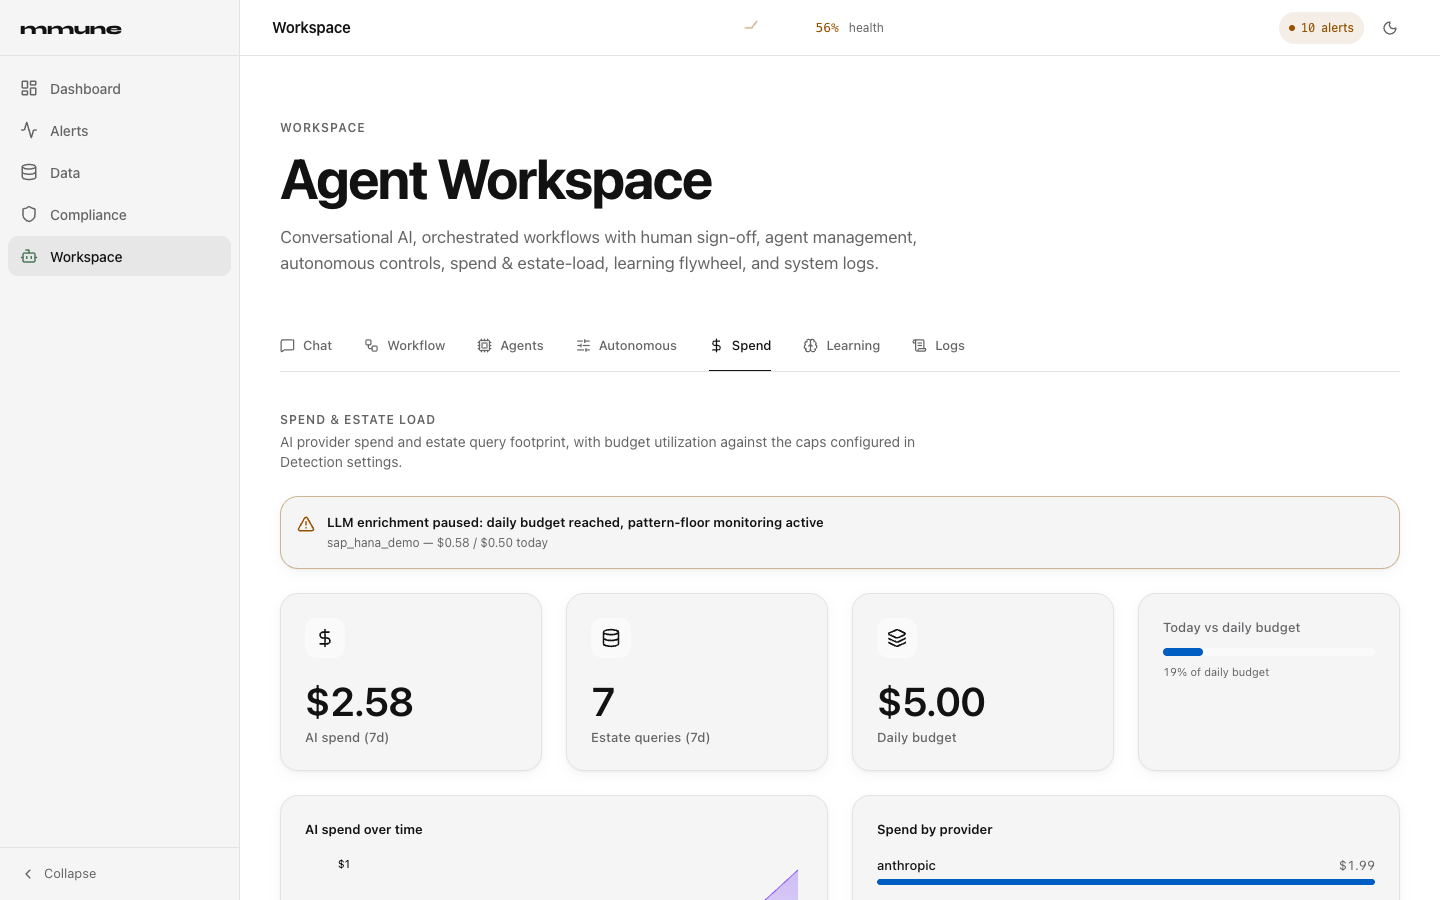
What the tab shows
| Item | Meaning |
|---|---|
| AI spend (7d) | Estimated dollar cost of AI model calls over the last seven days. Shows a dash when there is no usage. |
| Estate queries (7d) | The number of queries mmune ran against your integrations in the last seven days. |
| Daily budget | The global daily cap, or Unlimited when none is set. |
| Today vs daily budget | A bar showing today's spend as a percentage of the global daily cap. Reads No cap configured without a cap. |
| AI spend over time | A chart of daily cost. |
| Spend by provider | Cost per AI provider, for example Anthropic, OpenAI or Gemini. |
| Spend by component | Cost per part of mmune that made the calls. Calls with no label appear as unattributed. |
| Estate-load footprint (7d) | Per integration, the number of queries and the total rows read. |
| Budget warning | An amber card reading LLM enrichment paused: daily budget reached, pattern-floor monitoring active, with the integration and its spend against its cap. |
Empty panels read No usage recorded yet or No estate queries recorded yet.
Budgets and what happens at a cap
Two kinds of cap exist, and both are optional. With nothing configured, mmune only measures and enforces nothing. The AI cap is a daily and a monthly dollar limit. When it is reached, further AI calls are refused before they reach the provider, and the features that use them fall back to built-in pattern rules. Monitoring continues without the AI enrichment, and the warning card appears. The estate-load cap is a maximum number of sampling queries per monitoring cycle. After it is hit, extra sampling in that cycle is skipped, but the basic reachability check still runs. Streamed model calls are not covered by the dollar budget.
The global caps come from the server environment: MMUNE_AI_BUDGET_DAILY_USD (the alias MMUNE_LLM_DAILY_BUDGET_USD also works), MMUNE_AI_BUDGET_MONTHLY_USD and MMUNE_ESTATE_LOAD_CEILING_PER_CYCLE. A per-integration override replaces the global value for that integration only. For the estate-load ceiling the replacement is per field. For the AI caps, the daily and monthly limits are taken together from the override as soon as it sets either one, so an override that sets only a daily limit leaves the monthly cap unlimited for that integration instead of falling back to the global monthly cap. Per-integration overrides are set through the API.
Common tasks
- Check this week's cost: open Spend and read AI spend (7d), then Spend by provider to see which model costs the most.
- Find the busiest source: read Estate-load footprint (7d) and look for the integration with the most queries or rows read.
- See whether you are near the daily cap: read Today vs daily budget. A bar at 100% means the global daily cap is spent, so further AI calls are refused. The amber warning card means an integration with its own daily cap has reached it.
- Set a cap for one integration: an administrator or any user with
writesendsPUT /api/v1/monitoring/ai-budgets/<INTEGRATION_ID>withdaily_usd,monthly_usdorestate_load_ceiling_per_cycle. Fields you leave out are cleared.
API equivalent
GET /api/v1/monitoring/ai-usage?days=7&group_by=provider where group_by is a comma-separated list of provider, model, component, integration_id and day. GET /api/v1/monitoring/estate-load?days=7&group_by=integration_id where group_by may use integration_id, component, query_class and day. GET /api/v1/monitoring/ai-budgets/global returns the environment defaults and is read-only. GET /api/v1/monitoring/ai-budgets lists overrides. GET, PUT and DELETE /api/v1/monitoring/ai-budgets/{integration_id} read, replace and remove one override, and PUT and DELETE need write. A days value of 0 means all time.
Learning
Purpose. Show how much human feedback mmune has collected to improve itself, and how much more it needs. The "flywheel" is the loop in which your corrections make mapping confidence and alert thresholds better. This tab is a progress view. It does not train anything.
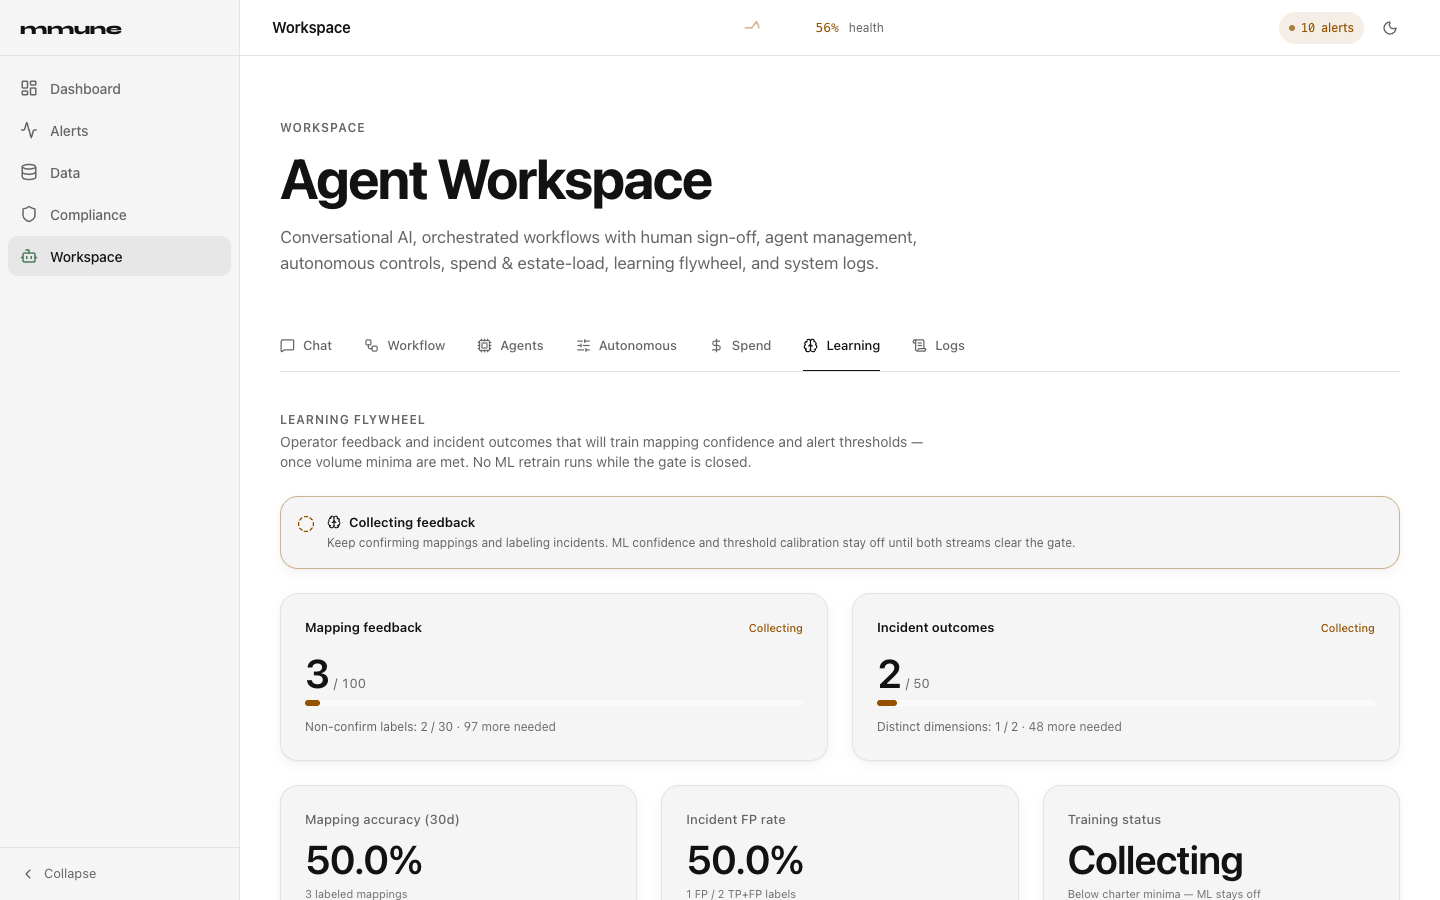
What the tab shows
A banner reads Collecting feedback until both feedback streams reach their minimum, and Ready to train after that. Two progress cards show the counts.
| Stream | Counts toward the gate | Minimum |
|---|---|---|
| Mapping feedback | Total labelled mappings, and how many of them are not plain confirmations | 100 total and 30 non-confirm |
| Incident outcomes | Incidents you labelled Real issue or False positive, and the number of distinct detection dimensions they cover | 50 labelled and 2 dimensions |
Three metric cards follow. Mapping accuracy (30d) is the share of labelled mappings that were correct. Incident FP rate is false positives divided by real issues plus false positives. Training status reads Ready to train or Collecting. Below them, Recent mapping feedback lists up to 20 rows labelled Confirm, Reject, Partial or Correction, and Recent incident outcomes lists up to 20 labelled incidents with a link to each. A Threshold proposals card is reserved for suggested alert-threshold changes.
Even when the banner says Ready to train, nothing retrains automatically. The tab states that retraining and threshold calibration stay gated, and while the gate is closed no machine-learning retraining runs. The threshold proposals card currently shows Suggest-only threshold calibration is not available yet.
How to add feedback
Incident outcomes are labelled on the Alerts page. Open an incident and use the Outcome label section, which offers Real issue, False positive and Inconclusive and an optional note. Inconclusive is saved but does not count toward the gate. Mapping feedback is recorded through the API with POST /api/v1/mapping/feedback and a feedback_type of correct, incorrect, partial or manual_override.
Common tasks
- See how close you are: open Learning and read the two progress cards. The line under each count says how many more labels are needed.
- Label an incident: go to Alerts, open the Incidents view, open an incident, optionally write a note, and click
Real issue,False positiveorInconclusive. Return to Learning and reload the tab to see the Incident outcomes count rise. - Check quality so far: read Mapping accuracy (30d) and Incident FP rate.
API equivalent
GET /api/v1/dashboard/learning/progress (optional project_id) returns accuracy metrics and the volume_gate object with counts, thresholds and deficits. GET /api/v1/mapping/feedback lists feedback (filters mapping_id, project_id, feedback_type and limit up to 500) and GET /api/v1/mapping/feedback/metrics returns accuracy and volume. GET /api/v1/incidents lists incidents, and POST /api/v1/incidents/{incident_id}/outcome sets the label (true_positive, false_positive or inconclusive) and needs write.
Logs
Purpose. A live, searchable stream of the activity log that agents and background jobs write, for checking what ran and why something failed.
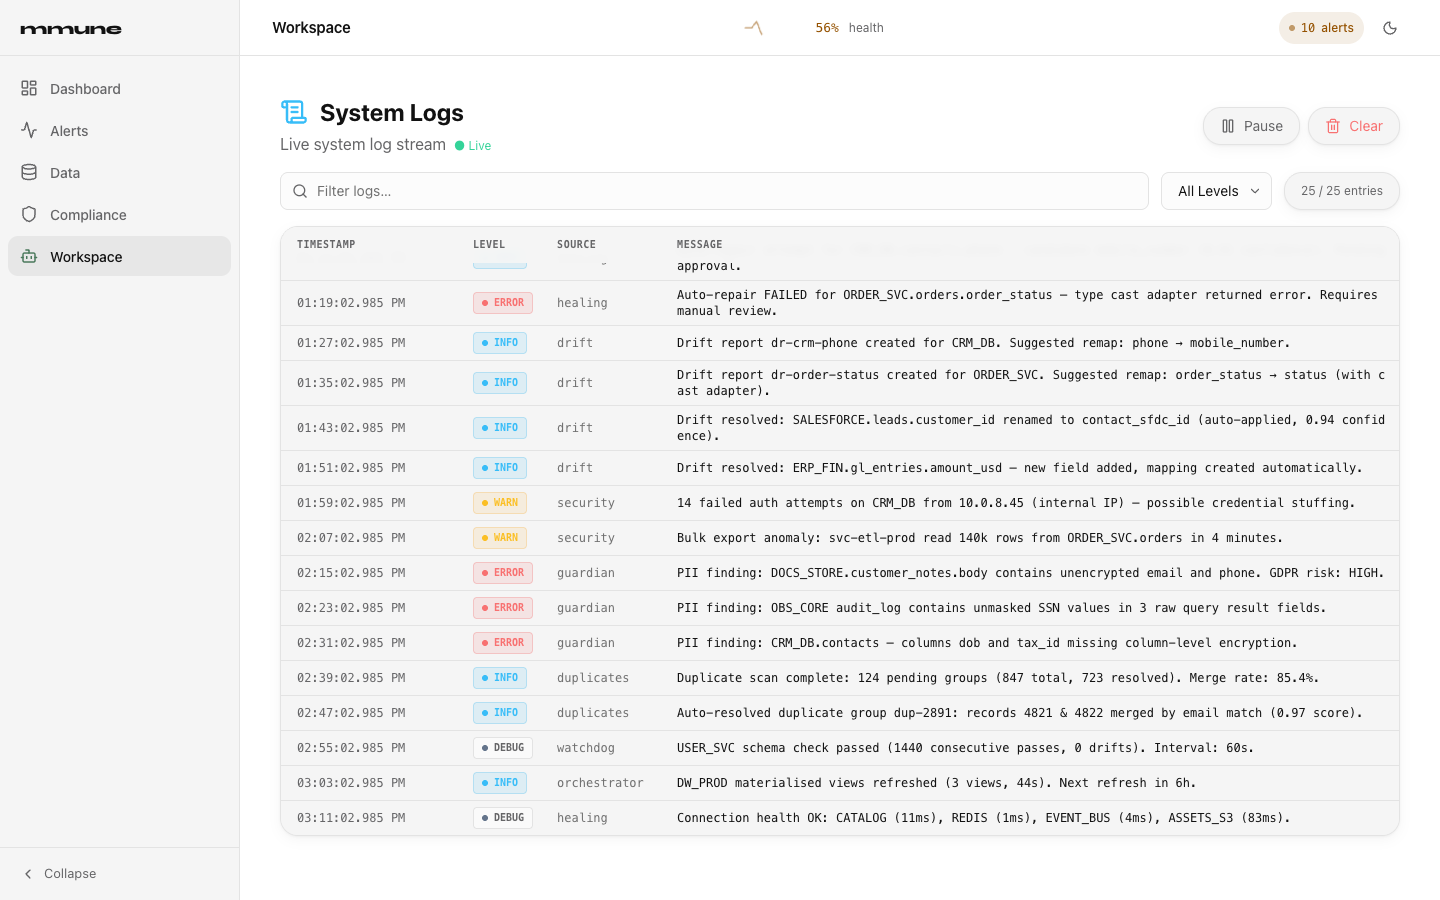
Controls
| Control | What it does |
|---|---|
| Live indicator | A green Live mark beside the subtitle while polling is on. |
| Pause / Resume | Stops or restarts the automatic refresh. |
| Clear | Deletes all stored agent logs for everyone. Needs the admin role. |
| Filter box | Placeholder Filter logs…. Matches text in the message or source. |
| Level selector | All Levels, Error, Warning, Info or Debug. |
| Entry counter | Shows shown / total entries. |
| Table | Columns Timestamp, Level, Source and Message. |
| Scroll to bottom | Appears when you scroll up. The view follows new entries only while you are at the bottom. |
The tab asks for new entries every three seconds, loads up to 200 at a time, and keeps the latest 1000 in the browser. A level named WARNING is shown as WARN, and any level the tab does not recognise, such as SUCCESS, is shown as INFO.
These are the application's agent and job logs, stored by mmune. They are not the container logs. Your administrator has access to container logs and restarts.
The Source column shows system for most entries.
Common tasks
- Find a failure: set the level selector to
Errorand read the Message column. - Follow one topic: type part of an integration name or job message in the filter box.
- Read without the list moving: click Pause, read, then click Resume.
- Empty the log: as an administrator, click Clear and confirm the entry counter drops to zero.
API equivalent
GET /api/v1/logs?limit=200&after_id=0. limit has a default of 100 and a maximum of 1000, and after_id returns only entries with a larger id, which is how the tab polls. Each entry has id, timestamp, level, agent_type, message and job_id. DELETE /api/v1/logs clears them and needs the admin role.
Permissions at a glance
| Action | Tab | Needs |
|---|---|---|
| Ask a question, draft a plan | Chat, Workflow | read |
| Run a plan (Approve & Execute) | Workflow | write |
| Start Discovery Agent | Agents | write |
| Start Guardian | Agents | admin role |
| Change duplicate mode, start or stop the watchdog, change polling | Autonomous | write |
| Change healing mode or threshold | Autonomous | admin role |
| View Spend, Learning and Logs | Spend, Learning, Logs | read |
| Set or remove a per-integration AI budget | API only | write |
| Clear logs | Agents, Logs | admin role |
A refused action returns HTTP 403 with the message Your role cannot do this. Ask an administrator. Read-only accounts have only read, and administrator accounts have read, write and admin. See Account and access for details.
Related pages
Concepts explains the vocabulary used here. Dashboard shows the overall health score. Alerts is where incidents are labelled and where drift and healing events appear. Data Explorer holds integrations, lineage, semantic mappings and Mapping Studio. Compliance shows the output of the Guardian scan.