Appearance
Compliance
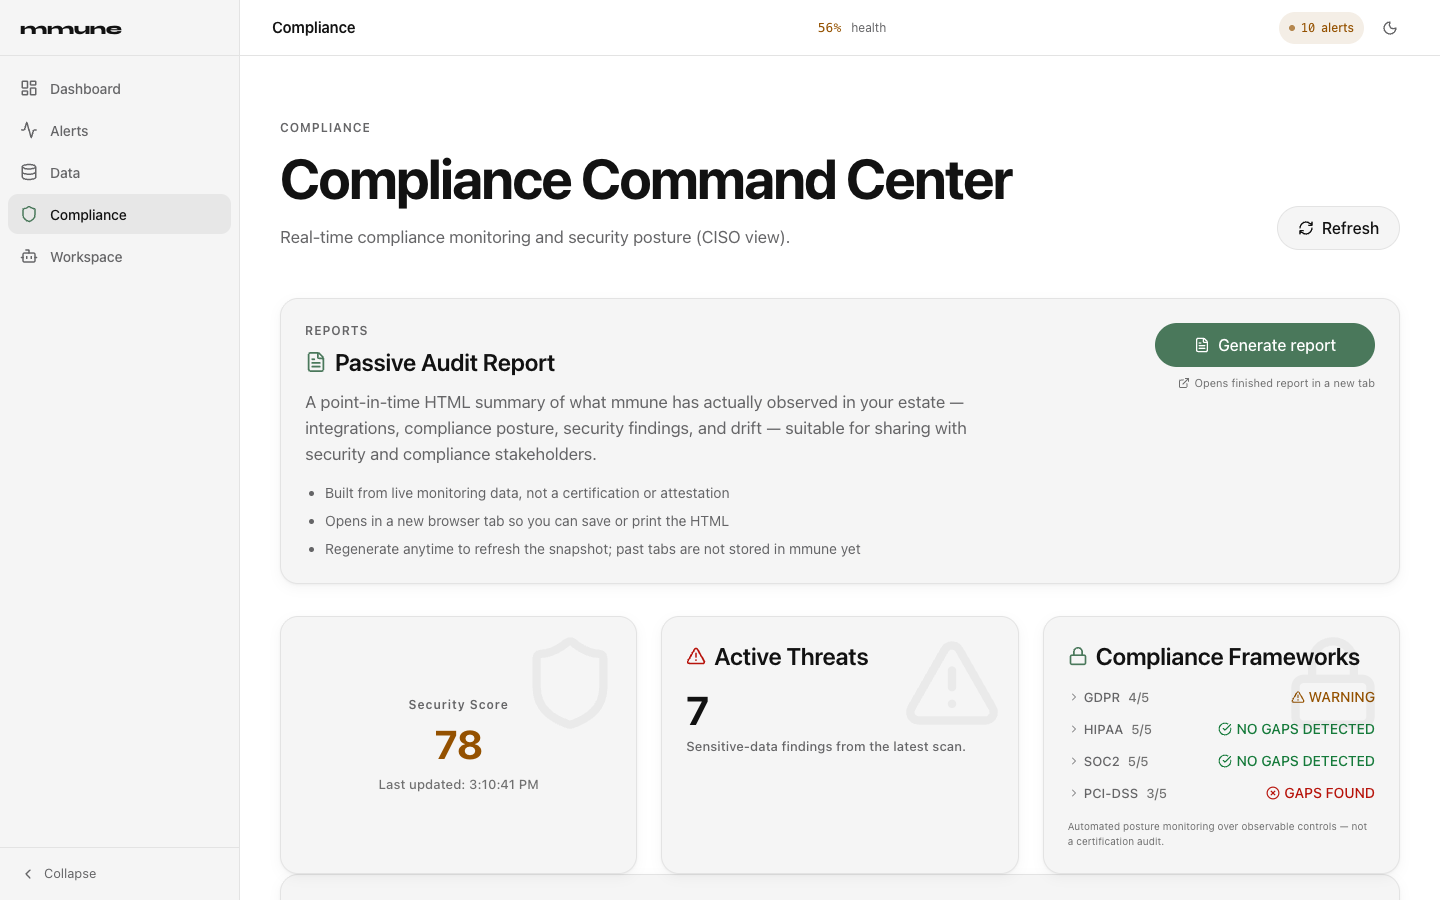
What this page covers: the Compliance Command Center at route /compliance, which holds the Passive Audit Report, the Security Score, the Active Threats count, the four compliance frameworks (GDPR, HIPAA, SOC2, PCI-DSS), the license panel, the security scan history, the Guardian Monitor with its Deep System Scan, the PII Pattern Explorer, and the list of sensitive-data findings.
Prerequisites / permissions: you must be signed in to the mmune web UI with a role that has the read permission to view the page. Generating the Passive Audit Report and reporting a finding as a ticket need the write permission. Running a Deep System Scan, applying a license and copying the renewal attestation need the administrator role. If your role is too low, the API answers "Your role cannot do this. Ask an administrator." and the UI shows an error.
Screenshots show sample data. Your numbers, integration names and timestamps will differ.
Open Compliance
Select Compliance in the left sidebar or go to /compliance. The older path /security redirects here. The link /compliance?focus=passive-audit-report opens the page and scrolls to the report card, and it is what the Dashboard Reports shortcut uses.
From top to bottom the page contains: the header with a Refresh button, the Passive Audit Report card, three summary cards (Security Score, Active Threats, Compliance Frameworks), the License card, Security Scan History (only when there is something to show), the Guardian Monitor, the PII Pattern Explorer, and the Sensitive-Data Findings list.
The page refetches its data every five seconds. Refresh forces an immediate refetch of monitoring data, compliance posture, scan history and findings. It does not start a security scan. To start a scan use Run Deep System Scan in the Guardian Monitor.
Generate the Passive Audit Report
The Passive Audit Report is a point-in-time HTML summary of what mmune has actually observed in your estate. It is built from live monitoring data. It is not a certification or an attestation, and the console does not list or reopen past reports, although mmune keeps each report it generates.
- Open
/compliance. - In the Passive Audit Report card, click Generate report. The button changes to "Generating report…" and stays disabled while it works.
- Wait. The page checks progress every 1.5 seconds and gives up after 60 checks, which is about 90 seconds.
- When the report is ready, it opens in a new browser tab. Save or print it from that tab.
If generation fails or times out, an error toast shows the reason, for example "Report generation timed out", and the button becomes available again. Because the report opens in a new tab only after the wait, a browser may block it as a pop-up. If nothing opens, allow pop-ups for the mmune address and click Generate report again.
The report covers the last seven days of activity. Its sections are Executive summary, Estate inventory, Lineage summary, Findings ranked by estimated impact, Compliance posture, and Coverage, which states what mmune could and could not assess. Regenerate it whenever you need a fresh snapshot.
API equivalent:
POST /api/v1/reports/audit(needswrite; optional bodywindow_start,window_end,client_name) returns{"report_id": "<id>", "status": "PENDING"}. PollGET /api/v1/reports/status/{report_id}untilstatusisCOMPLETEDorFAILED, then fetch the HTML withGET /api/v1/reports/{report_id}. See Security and platform API.
Security Score
The Security Score card shows one number from 0 to 100, where higher is better. After a scan, mmune computes it as 100 minus 10 for every HIGH sensitivity finding and 5 for every MEDIUM finding, never going below 0. The number is green at 90 and above, amber from 70 to 89, and red below 70. The caption underneath shows the time of the last refresh.
Before any scan has run, the card reads 100 because nothing has been flagged yet. To check whether a scan has really run, look at Security Scan History or at the Guardian Monitor, which says "Awaiting Scan" until the first scan completes.
API equivalent:
GET /api/v1/monitoring/data(fieldrisk_score). See Health and monitoring API.
Active Threats
Active Threats shows the number of sensitive-data findings from the latest scan, which is the same total shown in the Sensitive-Data Findings list further down. The Dashboard counts the same threats in its Security tile and in Threats Blocked.
API equivalent:
GET /api/v1/compliance/findings(fieldsummary.total).
Compliance Frameworks
This card lists GDPR, HIPAA, SOC2 and PCI-DSS. Beside each name is the number of controls that passed out of the total, for example 4/5. Click a framework to expand its controls. Each control shows its title, a status icon and the evidence mmune used. A framework is not clickable until a posture has been computed for it.
mmune evaluates a fixed set of observable controls against real system state, such as scan findings, masking policies, audit activity, authentication and TLS settings and watchdog configuration. A control that cannot be read is marked not assessed with the error as evidence. It is never silently passed. The footnote on the card says this is automated posture monitoring and not a certification audit.
| Framework status | Shown as | Meaning |
|---|---|---|
no_gaps | NO GAPS DETECTED (green) | No control failed or warned |
warning | WARNING (amber) | At least one control warned and none failed |
gaps_found | GAPS FOUND (red) | At least one control failed |
not_assessed | NOT ASSESSED (grey) | Every control was not assessed, or no posture exists yet |
Individual controls use four statuses: pass, warning, fail and not_assessed. The framework status is derived from them in this order: if all controls are not assessed, the framework is not assessed. Otherwise any fail makes it gaps_found, any warning makes it warning, and everything else is no_gaps.
Posture is recalculated after every completed security scan.
API equivalent:
GET /api/v1/compliance/posturereturnsframeworks(each withstatus,controls_total,controls_passedandcontrols),auto_scanand adisclaimer. See Security and platform API.
License
The License card shows the state of your mmune license. mmune checks the license offline, so it works on installations with no connection to the vendor. The card shows the customer name, a state label, the number of monitored systems against the cap, the expiry date with days left, and the license id.
| State | Label | Effect |
|---|---|---|
valid | Active | Everything runs |
grace | In grace period | The license has passed its expiry date but is within its grace window. Monitoring and new integrations still work. Apply a renewal soon. |
expired | Expired | The grace window has ended. Monitoring is suspended and new integrations are refused. |
missing | No license | No license was found. Monitoring is not running. |
invalid | Invalid license | A license was found but did not verify. The reason is shown in a red box. Monitoring is not running. |
Watchdog and AutoPilot run only in the Active and grace states. mmune re-evaluates the license every hour by default, stops monitoring if the license expires, and restarts it as soon as a valid license is in place.
The Monitored systems line shows used / cap, or used / ∞ when there is no cap. A bar below it is green under 80% of the cap, amber from 80%, and red at the cap. At the cap, a red note says new integrations are refused until you unregister one or raise the cap. If mmune detects that the system clock has been moved backwards, a warning line says "System clock rollback detected."
A banner above every page also appears when the state is grace, expired, missing or invalid, or when you are at the cap. It carries a Manage license button that opens /compliance. The banner rechecks every five minutes.
Apply a renewal license
- On the License card, click Apply license.
- Paste the vendor-signed token into the box that appears. It is a long text string, shown here as
<LICENSE_TOKEN>. - Click Apply. The button reads "Applying…" and is disabled until you paste text.
- On success the toast says "License applied", the card updates, and no restart is needed. Watchdog and AutoPilot restart by themselves if they had been stopped.
If the token is rejected, an error toast shows the reason. Click Cancel to close the box without applying.
API equivalent:
POST /api/v1/licensewith{"token": "<LICENSE_TOKEN>"}. Admin only. A rejected token returns status 400 with{"detail": {"code": "license_rejected", "reason": "<why>"}}.GET /api/v1/license/statusreturns the state shown on the card.
Copy the renewal attestation
At renewal, your vendor contact asks for a signed usage report, called the attestation, so they can confirm usage against your contract.
- On the License card, click Copy renewal attestation.
- The attestation is copied to your clipboard and the toast says "Attestation copied to clipboard". The button shows a check mark for two seconds.
- Paste it into your message to the vendor.
The attestation contains the install id, the current and peak number of registered systems, and a tamper-evident clock record. An attestation needs an active license. Without one, the toast reads "Failed to generate attestation" followed by the reason. The button needs the administrator role.
API equivalent:
GET /api/v1/license/attestation. Admin only. Returnsattestationandinstructions. See Security and platform API.
Security Scan History
This card appears once at least one scan has been recorded, or when the dashboard has a scoped scan signal. Each row shows the scan time, a "pattern-only" tag when the scan ran without the AI provider, the number of fields scanned, the number flagged, and the score. Up to 20 recent scans are listed. If no history exists yet, the card shows scoped signals such as "PII Scan" with a status of CLEAN, WARNING or NOT ASSESSED.
In the card header, a clock line explains the automatic scan schedule: "Scan running…" while a scan is in progress, "Next scheduled scan: <time>", or "Auto-scan every <N>h". mmune starts a scan on its own at startup if none exists or the last one is older than the interval, shortly after discovery completes or schema drift is detected (after a short debounce), and again on a repeating interval, 24 hours by default. An administrator can turn automatic scans off with the environment variable MMUNE_AUTO_SCAN_ENABLED=false, in which case the clock line is not shown.
A "pattern-only" scan means the AI provider was unavailable, so the scan used pattern matching alone. Findings are still valid but may miss unusual names.
API equivalent:
GET /api/v1/compliance/history?limit=20(limit 1 to 100). See Security and platform API.
Guardian Monitor
The Guardian Monitor is the security validation panel. It has four parts.
The ACTIVE or INACTIVE switch in the top right of the panel turns the Guardian check on or off for the data mapping workflow in your browser session. When it is active, mapped data is checked and masked before it is committed. The switch does not start or stop a security scan, and it resets when you reload the page.
Run Deep System Scan starts a full security scan of the schema information mmune has already collected. The default scan examines table and column names and types from introspection, not the values in your rows. While it runs, the button reads "Scanning Backend..." and a small log window streams progress lines once per second. When the job completes, or fails, the log stops updating and the findings refresh. If the scan cannot be started, for example because your role is not administrator, the log shows "Error starting scan". Only one deep scan runs from this panel at a time.
The findings counters and list show High, Medium and Low counts for the latest scan, a "Last scan" time with flagged / total fields (with "· pattern-only" if applicable), and a scrollable list of findings with their sensitivity and the reason. With no scan yet the panel reads "Awaiting Scan". With a clean scan it reads "No Findings Detected".
The Event Log at the bottom lists the last 50 events from the in-browser mapping and Guardian workflow, with time, level and message. It is not a log of security scans and it empties when you reload.
API equivalent:
POST /api/v1/guardian/scanwith{"target": "full"}(admin only) returns{"job_id": "<id>", "status": "PENDING"}. PollGET /api/v1/guardian/status/{job_id}?cursor=0forstatus(PENDING,RUNNING,COMPLETED,FAILED),logs,resultsanderror.GET /api/v1/guardian/scan/statusreturns a summary of the last completed scan. See Security and platform API.
PII Pattern Explorer
The PII Pattern Explorer shows where personal data patterns live across your connected systems. It reads the semantic registry and keeps only concepts whose name or field-name pattern matches a list of common personal data words such as email, ssn, phone, address, date of birth, credit card, bank account, name, passport and medical record number. Because the filter is based on naming, an oddly named field can be missed. The header shows how many patterns were flagged.
Click a pattern to expand it. mmune loads the systems that have fields mapped to that pattern and shows each as a chip with the system name and the number of matched fields. Hover a chip to see the field names. A red chip means that system is in an error state. With no match the panel says "No systems currently mapped to this pattern." If nothing has been introspected and mapped yet, the explorer reads "No PII patterns detected yet".
API equivalent:
GET /api/v1/semantic/signaturesandGET /api/v1/semantic/signatures/{signature_hash}/matches. See Mapping, lineage and semantic API.
Sensitive-Data Findings
This list shows unprotected personal or health data that the latest scan flagged, with the recommended fix. When the list is longer than what is shown, a counter reads "Showing N of M findings". The API returns up to 200 findings by default.
Each finding shows a coloured icon, a title in the form "SSN, Email detected in contacts.email", a sensitivity pill, the table.column location, the PII types, a "Why" line explaining the detection, and a "Recommended" action.
| Sensitivity | Colour | Maps to ticket priority |
|---|---|---|
| HIGH | Red | Critical |
| MEDIUM | Amber | High |
| LOW | Grey | High |
| Recommended action | Meaning |
|---|---|
| Redact (full removal) | Remove the value entirely |
| Mask (partial) | Hide part of the value |
| Hash (irreversible) | Replace it with a one-way hash |
mmune only recommends these actions. It does not change your data.
Report a finding as a ticket
- Find the finding and click Report on its row.
- If a ticketing provider is connected, a Create Ticket panel opens with the title, a description built from the finding (PII types, location, sensitivity, reason and recommended remediation), and a priority. Adjust them if you want.
- Click Create Ticket. A toast shows the ticket id, provider and URL.
If no provider is connected, an amber notice appears above the list. Set up ticketing in Alert Settings at /alerts/settings. See Alerts.
If the list is empty it reads "No sensitive-data findings". That means the latest scan flagged nothing, or no scan has run yet.
API equivalent:
GET /api/v1/compliance/findings?limit=200(limit 1 to 1000) returnsscan,findingsandsummarywithhigh,medium,lowandtotal. Reporting usesPOST /api/v1/ticketing/tickets. See Security and platform API.
Common tasks
Generate the audit report for a reviewer
Follow Generate the Passive Audit Report. Save the tab as HTML or print it to PDF from the browser.
Check why a framework shows gaps
Click the framework name in the Compliance Frameworks card. Controls marked FAIL are the gaps, and each one lists its evidence. Fix the cause, then run a Deep System Scan so posture is recalculated.
Run a scan now
Scroll to the Guardian Monitor and click Run Deep System Scan. You need the administrator role. Watch the log window until it stops, then check the counters and the Sensitive-Data Findings list.
Renew the license
Get the vendor-signed token, then follow Apply a renewal license. If the banner above the page said monitoring was suspended, it should disappear and monitoring should resume.
Tell a vendor how many systems you use
Click Copy renewal attestation and send the copied text to your vendor contact.
Related pages
Dashboard shows the Security tile in the health score. Alerts covers Guardian events and ticketing setup. The API overview explains authentication, and Security and platform API covers the compliance, guardian, reports and license endpoints in detail.