Appearance
Concepts
What this page covers: a plain-language orientation for new mmune users. It says what mmune is and what it is not, introduces the five pages of the console and how older addresses redirect to them, defines the words you will meet everywhere in the product, explains the difference between the demo and a real installation, and ends with a 15 minute first walkthrough.
Prerequisites / permissions: none to read this page. The walkthrough at the end assumes you can sign in and have at least the read permission. Two of its optional steps need write. Roles are explained in Account and access.
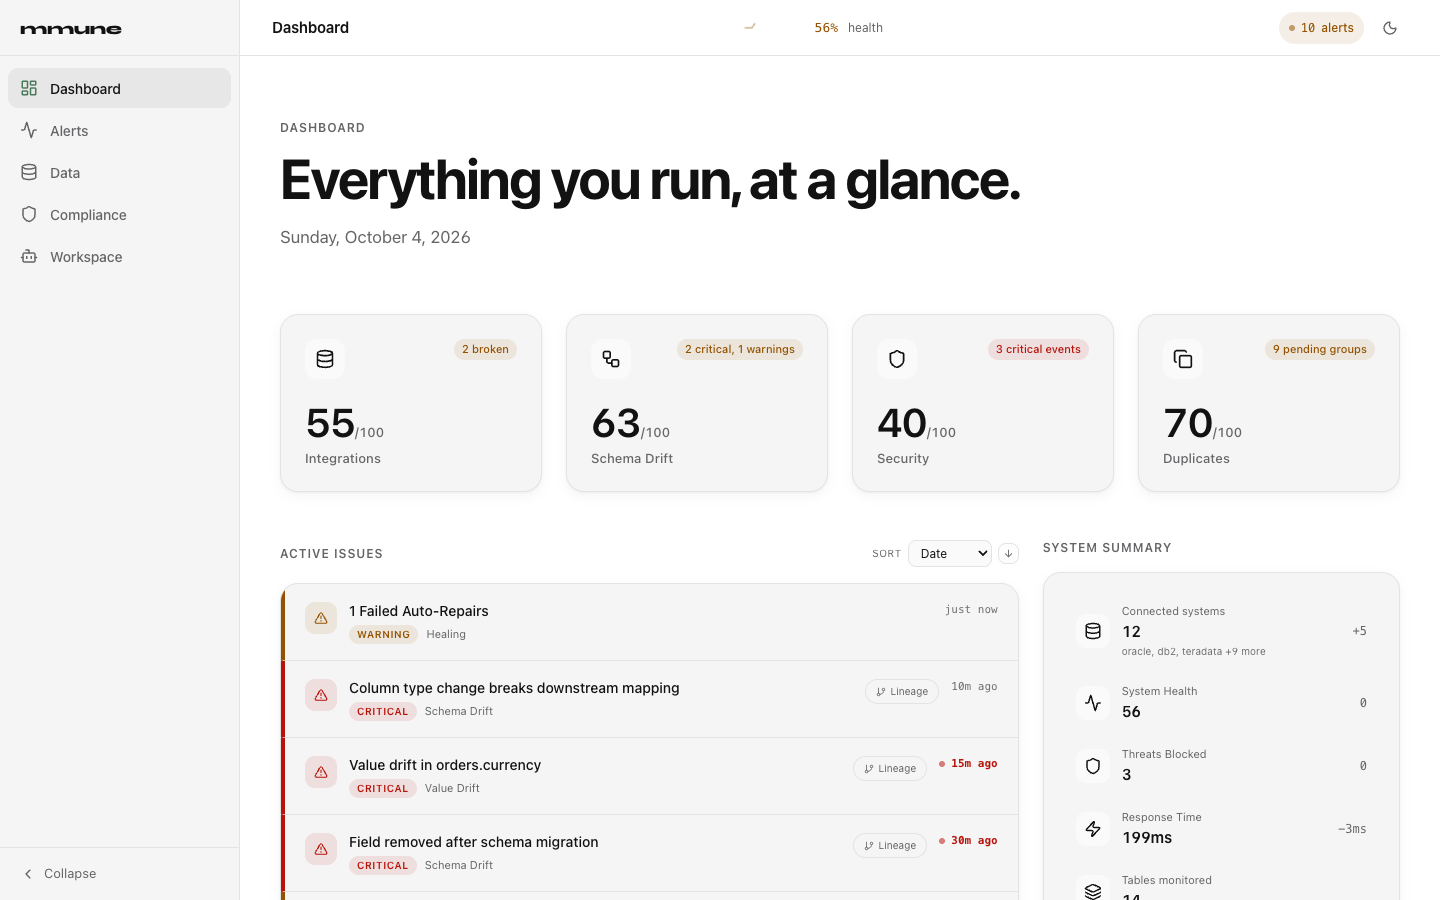
Screenshots show sample data. Your numbers, integration names and timestamps will differ.
What mmune is
mmune watches the data systems in your organization and tells you when something about them changes or breaks. It finds databases, queues and other systems, reads their structure, draws how data flows between them, and keeps checking them. When a column is renamed, a connection stops answering, a feed goes quiet or a field that holds personal data is not masked, mmune raises it as an alert, groups related alerts into an incident, and suggests what to do about it.
You use it through a web console with five pages. The same information is available through a REST API and, for AI agents, a read-only MCP server. See the API overview for the programmatic side, and Using mmune from an AI agent for the agent side.
What mmune is not
mmune connects out to your systems and observes them. It does not sit between your applications and your databases, so your data does not flow through it. That has a few consequences worth knowing before you rely on it.
mmune does not intercept, block or rewrite traffic between your systems. It reads schema and catalog information, and for value drift it runs read-only aggregate queries. It detects and recommends. Whether a fix is carried out is up to you, with two narrow exceptions that only touch mmune itself. Autonomous healing can update mmune's own semantic mapping store, and containment changes how mmune alerts and heals. Neither changes anything in your source systems.
mmune does not guarantee outcomes in your own systems. A finding is a statement about what mmune observed at the time it looked, and a detection can be missed if mmune cannot reach a system or lacks permission to read it. The compliance views are automated posture monitoring of observable controls. They are not a certification audit.
Duplicate protection is advice too. A pipeline can ask mmune whether a record is a duplicate before it writes, and mmune answers. The pipeline decides what to do with the answer.
The five pages
After you sign in, the left sidebar has five entries. Everything in the console lives under one of them.
| Sidebar entry | Address | What it is for | Guide |
|---|---|---|---|
| Dashboard | / | One screen with the overall health score, open issues, a summary of your estate and top recommendations | Dashboard |
| Alerts | /alerts | The event feed, incidents, and the settings for ticketing, routing, SLA targets and containment | Alerts |
| Data | /data | Integrations, network map, lineage, semantic mappings, duplicates, mapping studio, estate advisor, findings, tables and reconciliation | Data Explorer |
| Compliance | /compliance | Security score, compliance frameworks, the Passive Audit Report, security scans and the license panel | Compliance |
| Workspace | /workspace | Chat with your estate data, workflow plans, agents, autonomous settings, AI spend, learning and logs | Workspace |
Alert settings are a sub-page of Alerts at /alerts/settings, not a sixth page. Each page has tabs where it needs them, and you can link to a tab directly. The guide for each page lists its tab addresses.
Old addresses redirect
Earlier versions of the console had many standalone pages. They were folded into the five above, and the old addresses still work. Bookmarks, ticket links and shared URLs land on the page that now owns the content.
| Old address | Lands on |
|---|---|
/dashboard | / |
/health, /drift, /monitoring/watchdog, /healing, /autonomous | /alerts |
/integrations, /visual/network, /lineage | /data (the Integrations tab) |
/semantic, /intelligence | /data#semantic |
/duplicates | /data#duplicates |
/migration-studio | /data#mapping |
/security | /compliance |
/chat, /orchestration, /admin/agents, /logs | /workspace (the Chat tab) |
| Any other address | / |
Two details trip people up. The old /autonomous address goes to Alerts, but the autonomous settings now live on the Workspace page under the Autonomous tab. And /lineage and /visual/network open the Integrations tab, not the tab their old names suggest. If you want those, open the Lineage or Network Map tab yourself.
The address /oauth/callback is not a page you visit. The console uses it to finish sign-in flows with external systems when you connect an integration that needs OAuth.
Vocabulary
These terms appear on every page. The links go to the guide that explains the screen in detail.
| Term | What it means in mmune |
|---|---|
| Integration | A system mmune monitors, such as a database, queue, API or SaaS tool. An integration moves through discovered, configured, tested and registered. Only registered integrations are monitored and count toward your license. See Data Explorer. |
| Scan | Several different things share this word. A discovery scan looks for systems on the network. A deep system scan (run by Guardian) checks the schema information mmune already collected for sensitive data. An Estate Advisor scan looks for recommendations. Each is started from a different place. |
| Introspection | Reading the structure of a registered database: tables, columns, types, PII flags and estimated row counts. It reads catalog information, not your rows. Exact row counts are opt-in per database type with MMUNE_POSTGRES_ROW_COUNT_EXACT, MMUNE_MYSQL_ROW_COUNT_EXACT (also used for MariaDB) and MMUNE_MONGODB_ROW_COUNT_EXACT, and then mmune counts the rows of each table. |
| Lineage node | One box in the lineage graph: a source system, a database or a table. Edges between nodes show how data flows or which tables join. If something breaks, lineage shows what sits downstream of it. |
| Semantic mapping | mmune's record that a particular column has a business meaning, such as a customer email. It is built from field-name patterns and, when an AI provider is configured, from AI analysis. Mappings let mmune recognize the same concept across systems and suggest replacements when a field disappears. |
| Drift | A change from what mmune last saw. Schema drift is a change to structure, such as a renamed, removed or retyped column. Value drift is a change in what the data looks like, for example a spike in empty values. |
| Watchdog | The background process that polls your integrations on a schedule and checks them for drift and connection problems. You can see whether it is running at the top of the Alerts page. |
| Health status | Every node has one of three states. Healthy means mmune found nothing wrong. Degraded means there is a non-critical problem, such as drift. Broken means a critical problem, such as a failed connection. Health is the worst result across broken connections, drift reports, watchdog sessions and zombie-flow findings. |
| Healing | What mmune does when a connection breaks because a field moved. It asks the semantic layer for a replacement and a confidence score. |
| Alert mode and autonomous mode | The two healing modes. In alert mode, the default, mmune only shows the suggestion and raises an alert for a person to review. In autonomous mode it applies the top suggestion itself when the confidence is at or above a threshold. Applying means updating mmune's own mapping store. Only an administrator can change the mode. See Workspace. |
| Event | One line in the Alerts feed: a drift, healing, watchdog, security, Guardian or reconciliation signal. |
| Incident | A group of related findings that mmune believes share a cause, so you work one problem instead of many alerts. It has a status of open, acknowledged or resolved, a severity, and SLA deadlines. See Alerts. |
| Finding | A single fact mmune worked out about your estate. The word is used in three places. The First Findings list on the Dashboard and the Data Findings tab holds plain facts such as an unmasked PII column or a failed connection test. The Compliance page lists sensitive-data findings from security scans. An incident lists its member findings. They are related but not the same list. |
| Agent | A worker inside mmune that does one kind of job, such as discovery, validation, security checking or mapping. The Workspace Agents tab lists the six you can start from the browser. |
| AutoPilot | The loop that onboards integrations without a person clicking through each step: discover, configure, test, register, introspect. It is off by default and is turned on once by an administrator with environment variables. After a restart it resumes where it left off. See Data Explorer. |
| Containment | An optional mode that, during an incident, marks the origin node and everything downstream of it so mmune folds repeat alerts into the incident and holds back automatic healing there. It never changes your systems. |
| License | An offline, vendor-signed token that sets how many systems you may register and for how long. See Account and access. |
Demo versus a real installation
You may meet mmune in two very different settings, and they behave differently.
A demo environment shows sample data. It has no real systems behind it, so nothing you click reaches a real system and the numbers do not change in response to anything you do. Use it to learn the layout. The screenshots in this guide show sample data.
A real installation runs mmune inside your own environment or cloud and shows your estate. You sign in with an account, the data comes from the systems you have connected, and what you can do depends on your role. If a page shows "mmune hasn't discovered any integrations yet", that means nothing has been onboarded. A real installation does not use simulated data for monitoring. See Account and access.
A quick way to tell them apart: if you are asked to sign in, you are on a real installation.
Your first 15 minutes
This walkthrough takes a new user from sign-in to a feel for the whole product. Times are rough. Steps 3 and 7 name what to do if the screen is empty, which is common on a fresh install.
- Sign in (1 minute). Open the mmune address, enter your email and password. Ask your administrator if you do not have an account. If the form says "Sign-in failed", see Account and access.
- Read the Dashboard (2 minutes). On
/, look at the four score tiles and the health indicator in the top bar. Scroll to Active Issues and to "What mmune found in your estate". Click one row to see where it takes you. - Check what is connected (3 minutes). Open Data. On the Integrations tab, the Connected view lists registered systems and the Detected view lists systems found but not yet onboarded. If both are empty and AutoPilot is not running, a user with
writecan press Start Discovery Scan on the Detected view. Without a host list it scans only the machine running mmune, so ask your administrator how targets are set up for your estate. - Follow the data (3 minutes). Open the Lineage tab and search for a table you know. Click a node to see what sits downstream of it. This is how mmune answers "what breaks if this changes".
- See what mmune noticed (2 minutes). Open the Findings tab for the short list of facts mmune considers worth your attention first, with severity and a link to where you can look further.
- Look at alerts (2 minutes). Open Alerts. The strip at the top says whether the watchdog is running. Scan the Events feed, then open the Incidents tab. Open one incident to see its findings, status and deadlines. Acknowledging or resolving needs
write. - Check your license and compliance posture (1 minute). Open Compliance. The License card shows the state of your license and how many systems you have registered against the limit. The Compliance Frameworks card shows controls passed per framework. If you have
write, you can generate the Passive Audit Report, a point-in-time summary you can hand to a reviewer. - Ask a question (1 minute). Open Workspace. In Chat, press the chip
Give me a health summary, or type your own question such asShow me broken connections. Answers come from live mmune data and link back to the screen that owns it.
After this you know where everything lives. The page guides explain each control in turn, and the API overview covers the same data for scripts and other tools.
Related pages
Account and access covers signing in, roles, licensing and what a real installation requires. Dashboard, Alerts, Data Explorer, Compliance and Workspace describe the five pages. For the HTTP side, start with the API overview and the security and platform API.