Appearance
Alerts
What this page covers: the Alert Center at route /alerts (the Events and Incidents tabs), the Alert Settings page at /alerts/settings where ticketing, routing rules, ownership, SLA targets, impact pricing and containment are configured, and the alert count pill and health indicator in the top bar.
Prerequisites / permissions: you must be signed in to the mmune web UI with a role that has the read permission to see events, incidents and settings. Acknowledging or resolving an incident, labelling an outcome, creating a ticket, generating an analysis, muting a field, and saving any setting need the write permission. Changing the containment mode, severity threshold or max depth needs the administrator role. If your role is too low, the API answers with "Your role cannot do this. Ask an administrator." and the UI shows an error toast.
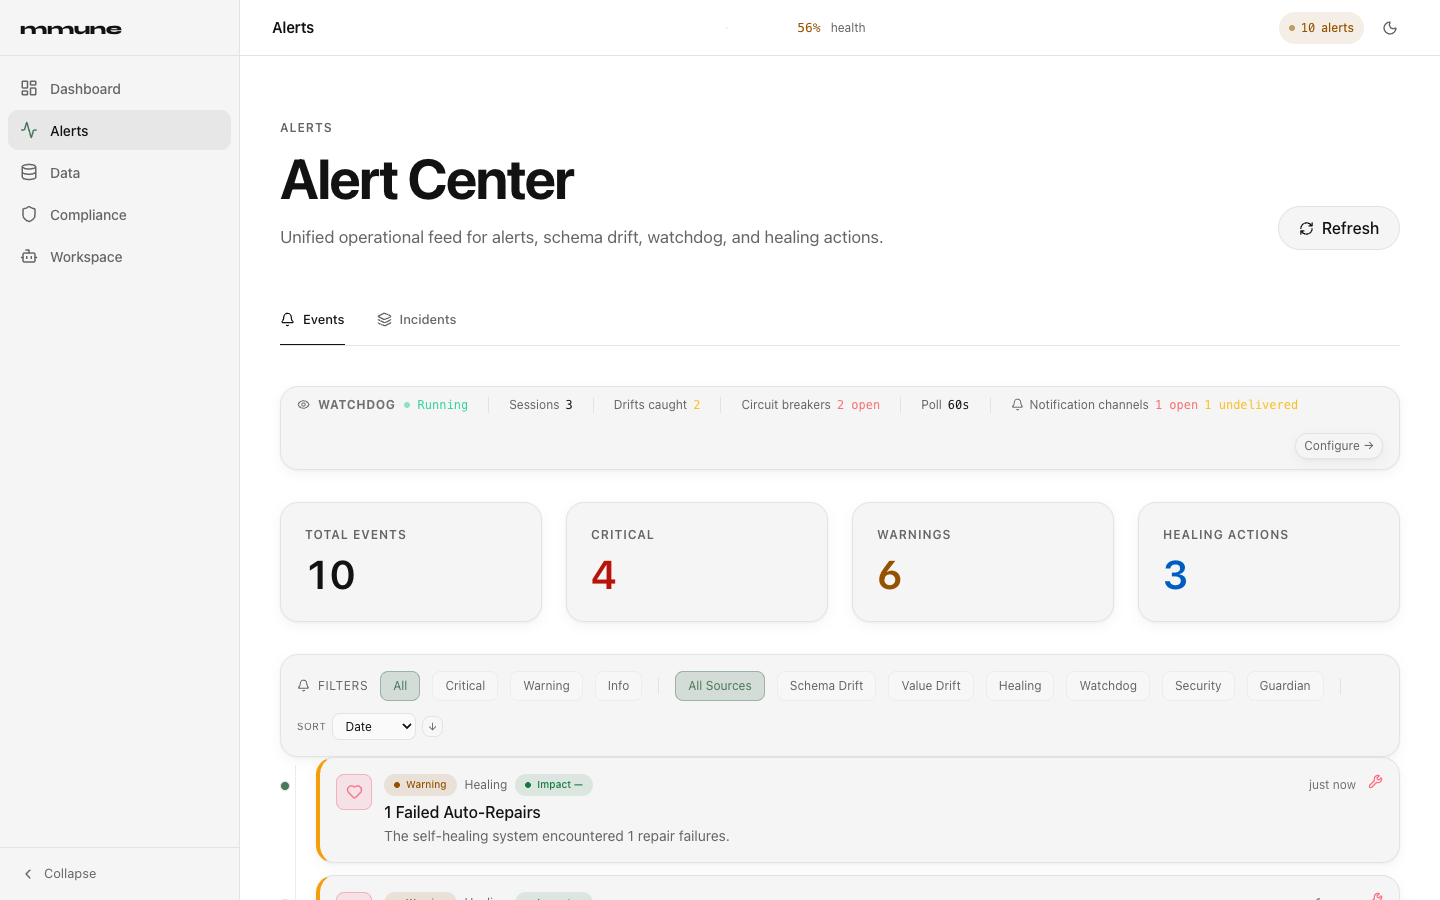
Screenshots show sample data. Your numbers, integration names and timestamps will differ.
The header alert count and health indicator
Two items in the top bar are visible on every page.
The health indicator in the middle shows a pulse line, the overall System Health percentage, the word "health", and an up or down triangle when the trend is moving. The percentage is green at 80 and above, amber from 50 to 79, and red below 50. The triangle compares the oldest and newest of the last eight readings, which arrive every six seconds, and appears only when they differ by more than three points. Click the indicator to open a popover with the four dimensions (Integrations, Schema Drift, Compliance, Duplicates), each with an icon for healthy, degraded or critical, a short label such as "2 broken", and an info button that explains how that dimension is scored. A dimension that has issues also shows an arrow button that jumps to the page where you can fix it. Press Escape or click elsewhere to close the popover. How the score is built is explained in Dashboard. Until the first reading arrives, the indicator shows a loading state.
The alert count pill on the right reads "N alerts" with a pulsing amber dot. N is the number of items in the unified alert feed plus the number of broken connections that need healing, which is the same number as Total Events on the Events tab. The pill is hidden when the count is zero. It refreshes every six seconds.
API equivalent: the same inputs as the Dashboard tiles. See Health and monitoring API.
Open the Alert Center
Select Alerts in the sidebar or go to /alerts. The old paths /health, /drift, /monitoring/watchdog, /healing and /autonomous redirect here. The page header has a Refresh button that reloads the event feed. When live updates have arrived, "Updated just now" appears next to it. The page watches for new findings and health changes about every ten seconds and refetches by itself when something changed, so you rarely need Refresh.
Below the header are two tabs, Events and Incidents. Several query parameters let you link straight to a view.
| URL | Effect |
|---|---|
/alerts?source=drift | Opens Events with the source filter preset. Accepted values: drift, value_drift, healing, watchdog, security, guardian, reconciliation |
/alerts?view=incidents | Opens the Incidents tab |
/alerts?incident=<incident_id> | Opens the Incidents tab and the detail drawer for that incident |
/alerts?openAlert=<alert_id>&openAlertKey=<source>::<title> | Opens Events and the detail window for the matching event. The Dashboard uses this when you click an Active Issues row |
Events tab
The Events tab is a single timeline of everything mmune has noticed that needs a person to look at it.
The watchdog strip
The strip at the top of the Events tab summarises the watchdog, which is the process that polls your integrations for drift and connection problems.
| Item | Meaning |
|---|---|
| Watchdog Running or Stopped | Whether the watchdog is currently running. A green pulsing dot means running. |
| Sessions | Number of active watchdog sessions, normally one per monitored integration |
| Drifts caught | Total drifts the watchdog has detected. Amber when above zero. |
| Circuit breakers | Number of open circuit breakers. Red when above zero. |
| Poll | Check interval of the first session, in seconds |
| Notification channels | A button. Shows how many notification channels have an open (not closed) circuit breaker, and how many standing PII alert deliveries went undelivered while the channel looked healthy. |
| Configure | Opens /workspace?tab=autonomous |
Click Notification channels to expand a panel with one entry per channel (shown by its lowercase channel id, for example slack, webhook, pagerduty, servicenow, teams and email_digest). Each entry shows the circuit breaker state (closed is healthy), the count of consecutive failures, whether the channel is configured and enabled, the most recent error text, and up to eight recent delivery attempts grouped by alert. An amber "Undelivered while healthy" block at the top lists attempts that failed or were skipped even though the breaker is closed, which usually means a bad endpoint URL or credentials rather than an outage. Error text is trimmed to 280 characters.
API equivalent:
GET /api/v1/watchdog/status,GET /api/v1/watchdog/sessions,GET /api/v1/notifications/channelsandGET /api/v1/notifications/deliveries?limit=200. Channel setup and the webhook channel are described in Webhooks and events. See also Health and monitoring API.
Summary tiles
Four tiles count what is in the feed before filters are applied: Total Events, Critical, Warnings, and Healing Actions. Healing Actions counts events whose source is Healing, which means failed auto-repair summaries and connections that need healing. It does not count completed repairs.
Filters and sorting
The Filters bar has two button groups and a sort control. The first group filters by severity: All, Critical, Warning, Info. The second filters by source: All Sources, Schema Drift, Value Drift, Healing, Watchdog, Security, Guardian, Reconciliation. Only one button in each group is active, and the two groups combine. The Sort control picks Date (default, newest first) or Severity, with an arrow button to reverse the order. If nothing matches, the page shows "No events match current filters".
Watchdog and connection problems appear under Healing.
Event sources
| Source | What creates the event | Severity rule |
|---|---|---|
| Schema Drift | A drift report from schema monitoring, for example a column type change or a removed field | Critical if the report is critical, otherwise warning |
| Value Drift | A change in the data values in a column, such as a null spike, an out of range value or a new category | Critical if the finding is critical, otherwise warning |
| Healing | A summary "N Failed Auto-Repairs" entry, and one entry per broken connection titled "<integration> requires healing" | Failed repairs are warning. A broken connection is critical if permanent, otherwise warning |
| Guardian | A summary "N Guardian Findings" entry from the last security scan | Critical when more than 5 findings, otherwise warning |
| Reconciliation | A mismatch found when comparing totals between two systems | Critical, info, or otherwise warning, as the finding states |
The Failed Auto-Repairs entry shows the time the page last refreshed. The Guardian entry uses the time of the last scan.
Reading an event row
Each row shows a coloured left edge for severity, a source icon, a severity pill, the source name, an impact pill, a relative time, a title and a two-line message. The impact pill reads impact followed by a tier (low, medium, high, critical) and, when mmune has one, a dollar estimate or a measured discrepancy. If mmune has no estimate, it shows a dash and the tooltip says "Impact estimate unavailable".
Some rows carry extra buttons. Lineage opens /data?tab=lineage focused on the affected node. Compliance appears on Guardian rows and opens /compliance. Healing rows show a wrench icon.
Open the event detail window
Click a row, or focus it and press Enter, to open the detail window. Close it with the X button or by clicking outside it. The window shows the title, source, local timestamp and an Issue ID, the severity and message, an impact panel, a ticketing section, and source-specific details.
The impact panel lists Tier, Records affected, Downstream (count of downstream consumers), and either Estimated cost or Measured discrepancy, followed by the rationale and the assumptions used. Dollar figures are estimates based on the rates set under Impact Pricing in Alert Settings. Records affected can be an exact count or a catalogue estimate, and the UI words the number accordingly.
The source-specific section depends on the event.
| Source | What the detail window adds |
|---|---|
| Healing | Resolved Today, Auto-Applied, Failed Repairs and Total Broken counts, a Connection Health split (healthy, degraded, broken), a Failed Repair Details block (integration, provider, field, error, attempt time, suggestion), and a button to open the Data Explorer |
| Guardian | One card per finding with category, regulation, integration, table, column, description and recommendation, plus an Open Compliance button |
| Schema Drift | Source, object, field, drift type, provider, a rename (old name to new name), an equivalence percentage, reasoning, detection time and a suggested mapping with its confidence |
| Value Drift | Integration, table, column, type, reasoning, detection time, and Before and After values, plus a Mute Field button |
| Reconciliation | Pairing name, the A and B tables, counts and their delta, sum delta, partition, comparison method, and SQL lookup statements you can run in your own tools to list affected records. mmune does not display the records themselves. |
Mute or unmute a value drift field
On a Value Drift event, click Mute Field to stop that column from producing new alerts and hide it from the default feed. The button turns into Unmute Field, and the field alerts again on new drift. The button appears only when the event has an integration, table and column. Muting needs the write permission.
API equivalent:
POST /api/v1/drift/value-drift/muteandPOST /api/v1/drift/value-drift/unmute, each with a JSON body ofintegration_id,tableandcolumn. See Health and monitoring API.
Create a ticket from an event
Click Create Ticket in the detail window. mmune first checks whether a ticketing provider is connected. If none is, an amber message says "No ticketing provider is connected yet. Set one up to create tickets from alerts." with a Set up ticketing link to /alerts/settings. If one is connected, the window shows "Connected provider: jira" or "servicenow" and a Create Ticket panel slides in from the right.
The panel has a Title, a Description (prefilled with the event message and, if present, the impact summary), a Priority selector (Critical, High, Medium, Low), and a read-only Ticket Metadata preview. The default priority maps from severity: critical becomes Critical, warning becomes High, and info becomes Medium. Create Ticket is disabled until both Title and Description are filled in. On success a toast shows the new ticket id, the provider and the ticket URL.
API equivalent:
GET /api/v1/ticketing/config, thenPOST /api/v1/ticketing/ticketswithtitle,description,priority(critical,high,medium,low), optionalalert_id,alert_source,incident_idandmetadata. See Health and monitoring API.
Incidents tab
An incident groups related findings that mmune believes share a cause, so you can work one problem instead of many alerts. Findings from the same origin integration and object are grouped when they arrive within the correlation window, which is 24 hours by default, and mmune uses lineage to pull in downstream effects. Each incident has a title, an origin, a list of member findings and its own status.
Filter the incident list
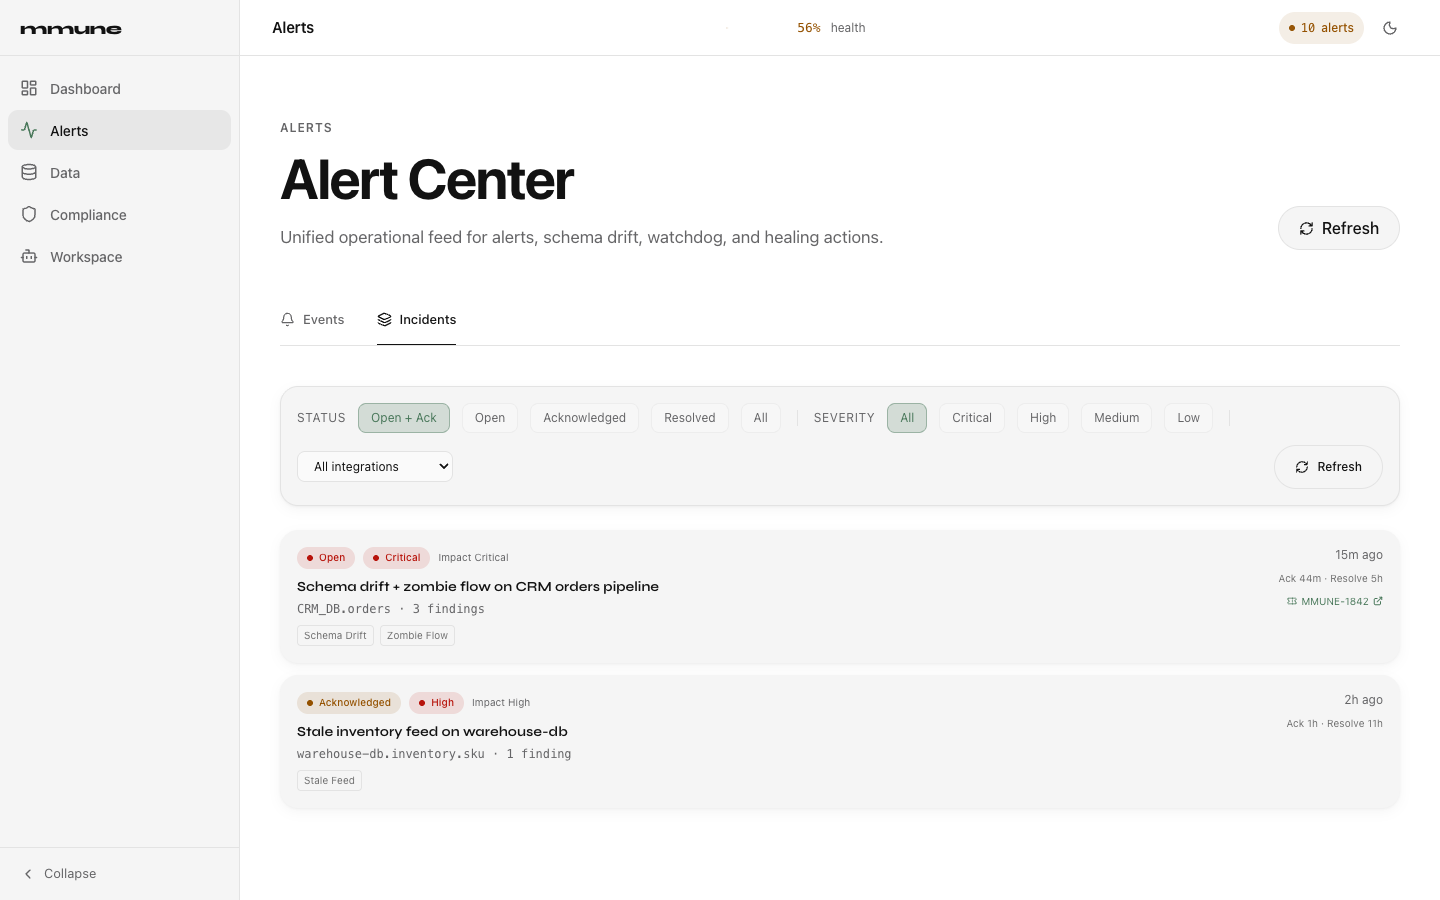
The filter bar has a Status group, a Severity group, an integration drop-down and a Refresh button. The default status is Open + Ack, which shows incidents that are open or acknowledged. The other choices are Open, Acknowledged, Resolved and All. Severity choices are All, Critical, High, Medium and Low. The integration drop-down appears when at least one incident exists and lists the origin integration ids. The tab loads up to 100 incidents and the filters apply to that set. When nothing matches, the tab reads "No incidents match the current filters."
Read an incident card
Each card shows a status pill, a severity pill, a red SLA breached pill when a deadline has passed, and an impact label. Below that are the title, the origin in the form integration.object, the number of findings, and a chip for each detection dimension. The right side shows the time of last activity and the remaining time to the acknowledge and resolve deadlines, for example "Ack 44m · Resolve 5h". Once a deadline passes, the text becomes "SLA breached". A linked ticket shows its id, a link to the external ticket and its status.
What the statuses mean
| Item | Value | Meaning |
|---|---|---|
| Incident status | open | New, nobody has taken it yet. Shown with a red pill. |
acknowledged | Someone has accepted it and is working on it. Amber pill. | |
resolved | Closed with a resolution note. Green pill. | |
| Severity | critical, high, medium, low | Critical and high use a red pill, medium amber, low green |
| SLA state | on_track, ack_breached, resolve_breached | Whether the acknowledge or resolve deadline has been missed |
| Ticket status | Open, In progress, Done, Cancelled, Unknown | Status of the linked Jira or ServiceNow ticket, synced from the provider |
| Outcome label | Real issue, False positive, Inconclusive | Your judgement of whether the incident was a true problem |
| Detection dimension | Schema Drift, Value Drift, Stale Feed, Zombie Flow, Duplicate, Security / PII, Watchdog, Job Failure | The kind of detection that contributed findings |
API equivalent:
GET /api/v1/incidents(paged, with optionalstatus,severityandintegration_idquery parameters) andGET /api/v1/incidents/{incident_id}. See Health and monitoring API.
Open an incident
Click a card to open the detail drawer on the right. Close it with the X button or by clicking outside it. From top to bottom, the drawer shows:
- The header with status, severity, SLA breached pill, title and origin.
- The detection dimensions, last activity, finding count, the owner (name and team) when the ownership registry matched one, and the Ack SLA and Resolve SLA time left.
- The linked ticket, if any.
- Member findings, a timeline of the individual detections with dimension, severity, age, the
integration.objectand the raw payload. - Impact estimate, when available.
- Containment, described below.
- RCA and runbook, described below.
- Outcome label.
- Actions (hidden once the incident is resolved) or the Resolution (once resolved).
Acknowledge an incident
Open the incident and, in the Actions panel, click Acknowledge. The status changes to acknowledged, mmune records who did it and when, and a toast says "Incident acknowledged". The button is shown only while the incident is open, and the API rejects acknowledging a resolved incident.
API equivalent:
POST /api/v1/incidents/{incident_id}/acknowledge, no body. Needswrite.
Resolve an incident
Open the incident, click Resolve in the Actions panel, type what fixed or mitigated it in the Resolution note box, and click Confirm resolve. Confirm stays disabled until the note has text. The incident then shows the resolution note, who resolved it and when.
API equivalent:
POST /api/v1/incidents/{incident_id}/resolvewith{"resolution": "<note>"}. Needswrite. A second resolve on the same incident returns an error.
Create a ticket from an incident
In the Actions panel, click Create ticket. The button appears only while the incident has no ticket and is not resolved. Creating a ticket from an incident works as it does for events; on success a toast shows the ticket id. Once created, the incident card and drawer show the ticket id and link, and the ticket status is kept in sync with the provider.
Generate or read the root cause analysis and runbook
The RCA and runbook section starts with "No RCA has been generated for this incident yet." Click Generate analysis to create one, or Regenerate analysis to replace it. Generation needs the write permission. A label tells you the source: "Generated by <provider>" when an AI provider produced it, or "Heuristic analysis (no AI provider configured)" when mmune used its rule-based fallback. The result has four parts: a narrative, Ranked candidates for the likely cause with a confidence percentage and a bar, an Evidence timeline, and Runbook steps. Each step has an order number, a title, a kind (diagnose, fix or verify), a description and sometimes a code snippet with a Copy button. mmune never runs a runbook step for you.
API equivalent:
GET /api/v1/incidents/{incident_id}/rca(404 until one exists),POST /api/v1/incidents/{incident_id}/rcato generate, andGET /api/v1/incidents/{incident_id}/runbook.mdfor the runbook as Markdown. See Health and monitoring API.
Label the outcome
In the Outcome label section you can add an optional note (up to 2000 characters through the API) and click Real issue, False positive or Inconclusive. The label shows with who set it and when. You can label an incident in any status, including resolved. The label is stored on the incident only. It does not change alert thresholds or detection rules.
API equivalent:
POST /api/v1/incidents/{incident_id}/outcomewith{"outcome": "true_positive" | "false_positive" | "inconclusive", "note": "<optional>"}. Needswrite.
Containment on an incident
The Containment section lists active quarantine marks for the incident. Containment never changes your systems. It only changes how mmune itself alerts and heals. Marks are placed on the origin node (origin) and on lineage nodes downstream of it (downstream). In active mode, mmune folds outbound alerts for the quarantined nodes under the holding incident and blocks automatic healing on them. In observe mode, a mark is shown with an observe tag for visibility only. The section shows counts for Origin and Downstream, a "Folded alerts" count and an "Impact radius truncated" notice when the depth limit cut the search short.
Each mark shows its node key, role, reason and a View on lineage link. To remove a mark, click Lift, then type a reason in the prompt. A reason is required and cancelling the prompt leaves the mark in place. The Re-validate now button appears only when re-validation is available for that incident, and it starts a re-validation sweep. With no marks the section reads "No active quarantine marks."
API equivalent:
GET /api/v1/containment/marks?incident_id={id},POST /api/v1/containment/marks/{mark_id}/liftwith{"lift_reason": "<text>"}, andPOST /api/v1/containment/incidents/{incident_id}/revalidate. See Health and monitoring API.
Alert Settings
Alert Settings at /alerts/settings holds everything that controls where alerts go and how they are costed. There is no sidebar item for it. Open it by going to /alerts/settings, or by clicking Set up ticketing in an event detail window when no provider is connected. Back to Alert Center returns you to /alerts.
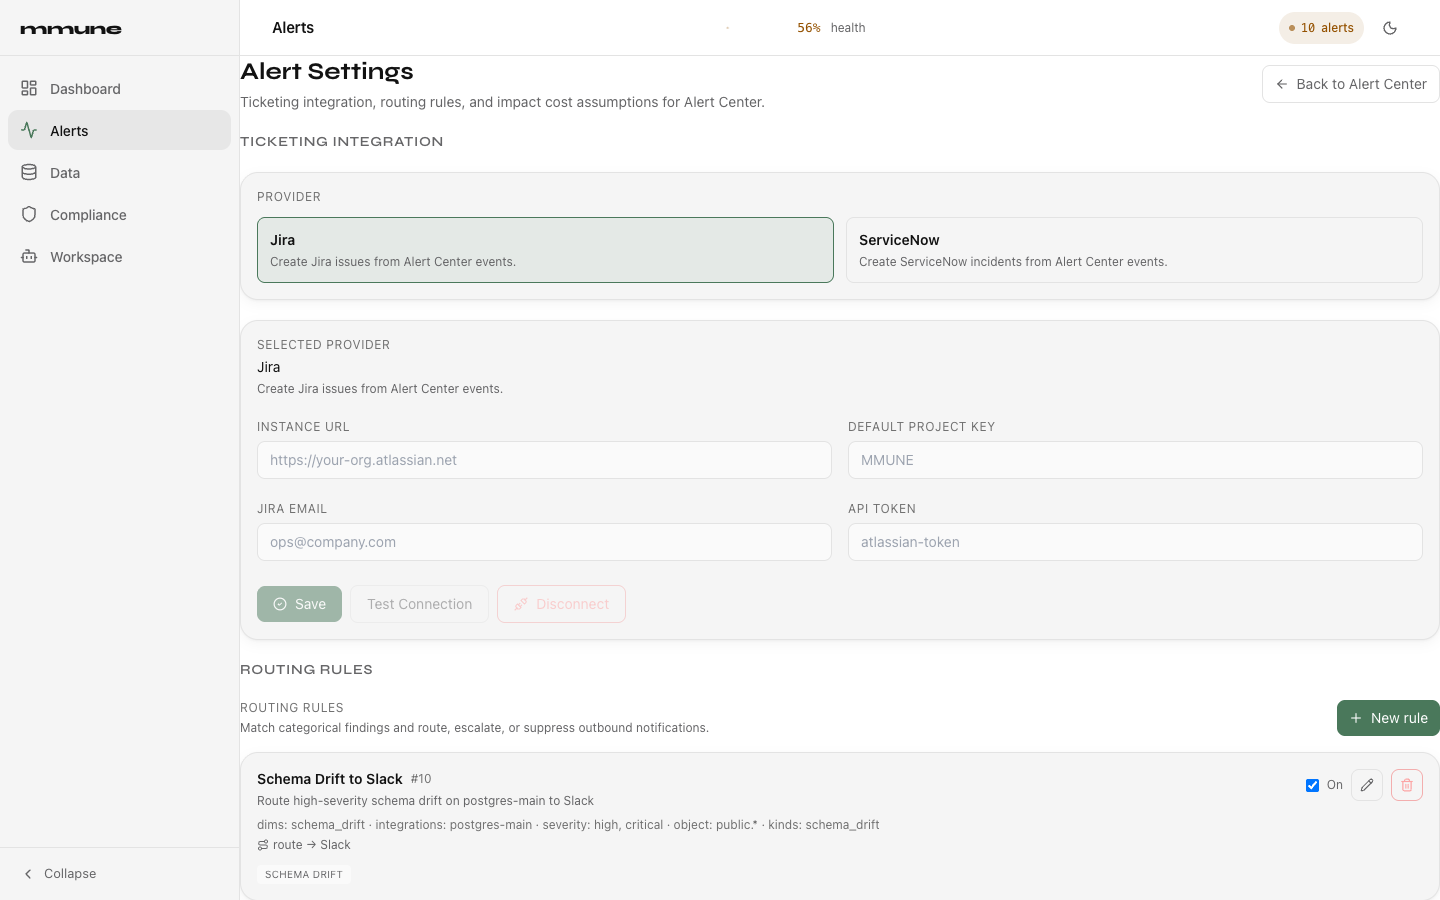
The page has five sections in this order.
Ticketing integration
Pick a provider card, Jira or ServiceNow, then fill in the form. The Instance URL is the base address of your Jira or ServiceNow site. For Jira you also enter a Default Project Key, the Jira Email and an API Token. For ServiceNow you enter a Default Table (for example incident), a Username and a Password.
| Button | What it does |
|---|---|
| Save | Stores the configuration. Disabled until Instance URL has text. |
| Test Connection | Checks the saved configuration against the provider. Disabled until a configuration exists. Shows "Connection test passed." or "Connection test failed." |
| Disconnect | Removes the ticketing configuration |
After you save, mmune does not show credentials again, so enter them each time you change the configuration.
API equivalent:
GET /api/v1/ticketing/providers,GET /api/v1/ticketing/config,POST /api/v1/ticketing/config,POST /api/v1/ticketing/testandDELETE /api/v1/ticketing/config. See Health and monitoring API.
Routing rules
Routing rules decide which notification channels receive a finding and how its severity is treated. Click New rule to start one. Each rule has these fields.
| Field | Meaning |
|---|---|
| Name | Required. The rule id is derived from it, so two rules cannot share a name. |
| Priority (lower = first) | Evaluation order. Default 100. |
| Description | Optional note |
| Match: dimensions | Toggle chips for Schema drift, Value drift, Connection, Zombie flow, Duplicate, Security / PII, Stale feed, Job failure. Empty matches any. |
| Integration IDs | Comma-separated list of integration ids |
| Object key pattern (glob) | For example public.* |
| Match: severity | Toggle chips for low, medium, high, critical |
| Kinds (drift_type / event) | Comma-separated list, lowercased on save |
| Actions | At least one. See below. |
| Rule enabled | Checkbox |
The action types are Route to channels (pick one or more of the channels; a warning mark means the channel has no credentials yet, so delivery may fail), Escalate severity (bump one level, or set a target severity), Suppress outbound (stop outbound notifications, with an optional cooldown in seconds), and Create ticket (uses the connected ticketing provider; a warning shows if none is configured). Click Save rule. Validation messages tell you if the name is missing, no action was added, a route has no channel, or an escalate action has no target.
In the rule list, each rule shows its priority, a summary of its match and actions, an On checkbox to enable or disable it at once, a pencil to edit and a trash can to delete after a confirmation. If you lack write permission, saving shows "You need write permission to save alert rules".
API equivalent:
GET /api/v1/monitoring/alert-rules,POST /api/v1/monitoring/alert-rules,PUT /api/v1/monitoring/alert-rules/{rule_id},DELETE /api/v1/monitoring/alert-rules/{rule_id}andGET /api/v1/notifications/channels. Outbound webhooks are covered in Webhooks and events.
Ownership and SLA
The Ownership Registry tells mmune who to notify when an incident breaches an SLA. Click Add owner and fill in Name (required), Team, Contact, Priority, an Integration pattern (glob, for example erp-*), an Object key pattern (glob, for example orders*) and the Notify channels to use. A lower priority number wins when more than one owner matches, and a tighter pattern breaks ties. An owner with no channels selected is notified on all channels when a breach happens. Matching owners appear on the incident drawer.
The SLA Deadlines (minutes) table sets the acknowledge and resolve targets for each severity. The clocks start at first detection. The defaults, shown under the table, are critical 15 minutes to acknowledge and 4 hours to resolve, high 1 hour and 24 hours, medium 4 hours and 3 days, and low 24 hours and 7 days. The input field has a minimum of 1, so enter whole numbers of at least 1. Click Save SLA policy to apply.
API equivalent:
GET/POST /api/v1/incidents/owners,PUT/DELETE /api/v1/incidents/owners/{owner_id},GET /api/v1/incidents/slaandPUT /api/v1/incidents/sla(all four severities are required in bothack_minutesandresolve_minutes).
Impact pricing
Two optional fields, Cost per Affected Record ($) and Cost per Hour Stale ($), set the rates mmune uses to turn an impact estimate into a dollar figure. Dollar figures are estimates under these assumptions, never ground truth. Leave a field blank to stop showing a dollar figure for that factor. Under each field a note says where the value comes from: set here, set by a deploy-time environment variable, or not set. Click Save. Saving writes both fields together, so a blank field clears that value.
API equivalent:
GET /api/v1/reports/impact-cost-configandPUT /api/v1/reports/impact-cost-configwithcost_per_recordandcost_per_hour, each a number of 0 or more, or null.
Containment
The Containment section controls lineage-aware containment for the whole estate.
| Field | Values | Meaning |
|---|---|---|
| Mode | Off, Observe, Active | Off disables containment. Observe marks nodes for visibility without folding alerts or blocking healing. Active quarantines the impact radius, folds outbound alerts under the holding incident and blocks healing auto-apply on those nodes. |
| Severity threshold | low, medium, high, critical (default shown is critical) | The lowest incident severity that triggers containment |
| Max depth | 1 to 200 (default shown is 10) | How many lineage hops downstream of the origin to quarantine |
Click Save. A value outside 1 to 200 for max depth is rejected before it is sent. Changing these settings needs the administrator role.
API equivalent:
GET /api/v1/containment/configandPUT /api/v1/containment/configwithmode,severity_thresholdandmax_depth. Admin only.
Common tasks
Acknowledge an incident
Go to Alerts, choose the Incidents tab, click the incident, and click Acknowledge in the Actions panel.
Resolve an incident and record what fixed it
Open the incident, click Resolve, write the resolution note, and click Confirm resolve. If your team uses tickets, click Create ticket first so the ticket link is on the incident.
Find everything wrong with one integration
On the Incidents tab, pick the integration in the drop-down and set Status to All. On the Events tab there is no per-integration filter, so use the Lineage button on a row to jump to the integration in the data graph.
Send critical schema drift to Slack
Open /alerts/settings, scroll to Routing Rules, click New rule, give it a name, choose the Schema drift dimension and the critical severity, add a Route to channels action, select Slack, and click Save rule. Make sure Slack shows no warning mark, otherwise the channel has no endpoint configured yet.
Get tickets created in Jira
Open /alerts/settings, choose Jira, enter the Instance URL, project key, email and API token, click Save, then Test Connection. After that, Create Ticket works on every event and incident.
Find out why a notification did not arrive
On the Events tab, click Notification channels in the watchdog strip and look for the channel. A breaker state other than closed means mmune stopped sending after repeated failures. The latest error text and the recent attempts explain why.
Related pages
Dashboard shows the top issues and the health score. Compliance covers Guardian findings and the Passive Audit Report. The API overview explains authentication, and Webhooks and events describes how to receive alerts in your own systems.