Appearance
Data Explorer
What this page covers
This guide explains the Data Explorer page at the /data route of the mmune console. It walks through the ten tabs in the order they appear (Integrations, Network Map, Lineage, Semantic, Duplicates, Mapping Studio, Estate Advisor, Findings, Tables, Reconciliation), shows how integrations get onboarded, and lists the API call behind each tab.
Screenshots show sample data.
Prerequisites and permissions
You need to be signed in to the console. Almost every API call mmune serves requires a Bearer token whose user holds the read permission. The exceptions are sign-in, token refresh and the GET /health liveness check. Anything that changes state (starting a scan, configuring, testing or registering an integration, resolving a duplicate group, changing the duplicate mode, running an Estate Advisor scan, dismissing a finding, running a mapping) also requires the write permission or the admin role. A few read-only POST calls are open to read users, including POST /api/v1/mapping/suggest and POST /api/v1/semantic/find-semantic-match. In the API examples below, <BASE_URL> is the address of your mmune backend and <TOKEN> is a Bearer token you obtained by logging in.
Related references: Integrations and discovery API and Mapping, lineage and semantic API.
Page layout and navigation
The page title is Data Explorer. Below it sits a tab bar. The console has ten tabs, all covered here.
Each tab has an id that you can use in a link. Both URL forms work, and ?tab= wins if you supply both.
| Tab | Id | Link examples |
|---|---|---|
| Integrations | integrations | /data, /data#integrations, /data?tab=integrations |
| Network Map | network | /data#network, /data?tab=network |
| Lineage | lineage | /data#lineage, /data?tab=lineage |
| Semantic | semantic | /data#semantic, /data?tab=semantic |
| Duplicates | duplicates | /data#duplicates, /data?tab=duplicates |
| Mapping Studio | mapping | /data#mapping, /data?tab=mapping |
| Estate Advisor | recommendations | /data#recommendations, /data?tab=recommendations |
| Findings | findings | /data#findings, /data?tab=findings |
| Tables | tables | /data#tables, /data?tab=tables |
| Reconciliation | reconciliation | /data#reconciliation, /data?tab=reconciliation |
An unknown id falls back to Integrations. Clicking a tab does not change the address bar, so copy the deep link yourself if you want to share one.
The Lineage tab accepts extra parameters that move the camera to a node and highlight everything downstream of it: focusNodeId (a lineage node key), plus the fallbacks integrationId, table and field. Example: /data?tab=lineage&focusNodeId=<NODE_KEY>. Once the camera has moved, the address is rewritten to /data?tab=lineage.
Older URLs redirect into this page. /semantic and /intelligence go to /data#semantic, /duplicates goes to /data#duplicates, and /migration-studio goes to /data#mapping. /integrations, /visual/network and /lineage redirect to plain /data, so they open the Integrations tab, not the tab their old name suggests.
On a phone (narrower than 640 pixels), Network Map, Lineage and Mapping Studio show a "designed for desktop" message instead of their content.
How integrations get onboarded
An integration (a database, queue, API or SaaS system) moves through these stages: discovered, configured, tested, registered, and for databases, introspected. There are two ways through: you can do each step by hand from the Integrations tab or the API, or you can let AutoPilot do all of it.
Manual path
- Discovery. On the Integrations tab, switch to Detected and press Start Discovery Scan. The scan probes ports and APIs and stores what it finds. With no hosts supplied, as in the console button, it scans
127.0.0.1, which is the machine running mmune. To scan other hosts, call the API with ahostslist. - Credentials. A discovered row has status Discovered. Press the gear icon to open Configure Integration and save credentials. The row becomes Configured. You can also save credentials through the API with a
credentialsobject. - Test. Press the refresh icon to test the connection. A successful test keeps the row at Configured. The Detected view has no Latency column, so the connection time is not shown here; it appears in the Latency column of the Connected view once the integration is registered. Use the critical
failed_connection_testfinding on the Findings tab for a lasting record of a failed test. - Register. Press the plus icon. The row leaves the Detected list and appears under Connected with status Registered. Registration also creates a lineage source node for the integration, so Network Map, Lineage and Integrations agree. Registration is the point where license seats are counted. If the install is at its licensed cap the API refuses with HTTP 403 and code
license_cap_exceeded. - Introspect. Introspection reads table-level schema (source, database, table, columns, PII flags, row counts) and writes lineage nodes. By default it reads catalog and schema information only and does not scan row data, and row counts are catalog estimates. An administrator can enable exact row counts for PostgreSQL, MySQL and MongoDB, in which case introspection takes an exact count for each table of that provider. The console has no button for introspection. AutoPilot runs it, or you call
POST /api/v1/integrations/discovered/{id}/introspect.
AutoPilot path
AutoPilot is the autonomous onboarding loop. It reads the database state on every pass, so a backend restart resumes where it left off. It is off by default and is switched on once with environment variables on the backend:
| Variable | Purpose | Default |
|---|---|---|
MMUNE_AUTOPILOT_ENABLED | Turns AutoPilot on | off |
MMUNE_SCAN_TARGETS | Hosts or CIDR ranges to scan, comma separated | none |
MMUNE_SCAN_PORTS | Ports to probe | a built-in list of database, queue and HTTP ports |
MMUNE_CREDENTIAL_PROFILES | Path to a YAML or JSON credential profile file | none |
MMUNE_AUTOPILOT_INTERVAL | Seconds between reconcile passes (minimum 30) | 120 |
MMUNE_RESCAN_INTERVAL | Seconds between periodic re-scans, 0 disables | 3600 |
MMUNE_REGISTER_DETECTED_ONLY | Also registers endpoints that are only recognised, not mappable | off |
When credentials are needed, AutoPilot tries them in this order: a matching profile or credentials you supply, and otherwise it marks the integration as needing credentials and retries every 15 minutes. After a successful introspection it announces the discovery to the rest of the system, which starts the downstream agents. It also writes per-column semantic mappings, infers cross-source links between tables, and recomputes the Findings list on each pass.
Endpoints that mmune recognises but cannot map (for example SSH or plain HTTP services) are recorded as detected only. By default they are not registered and do not use a license seat.
AutoPilot introspects each database once. The watchdog then re-introspects every registered integration on a timer (MMUNE_REINTROSPECT_INTERVAL_SECONDS, default 300), so a real schema change is normally picked up within about five minutes. To force it sooner, call POST /api/v1/discovery/reintrospect/{integration_id} to re-read the live schema.
Integrations tab
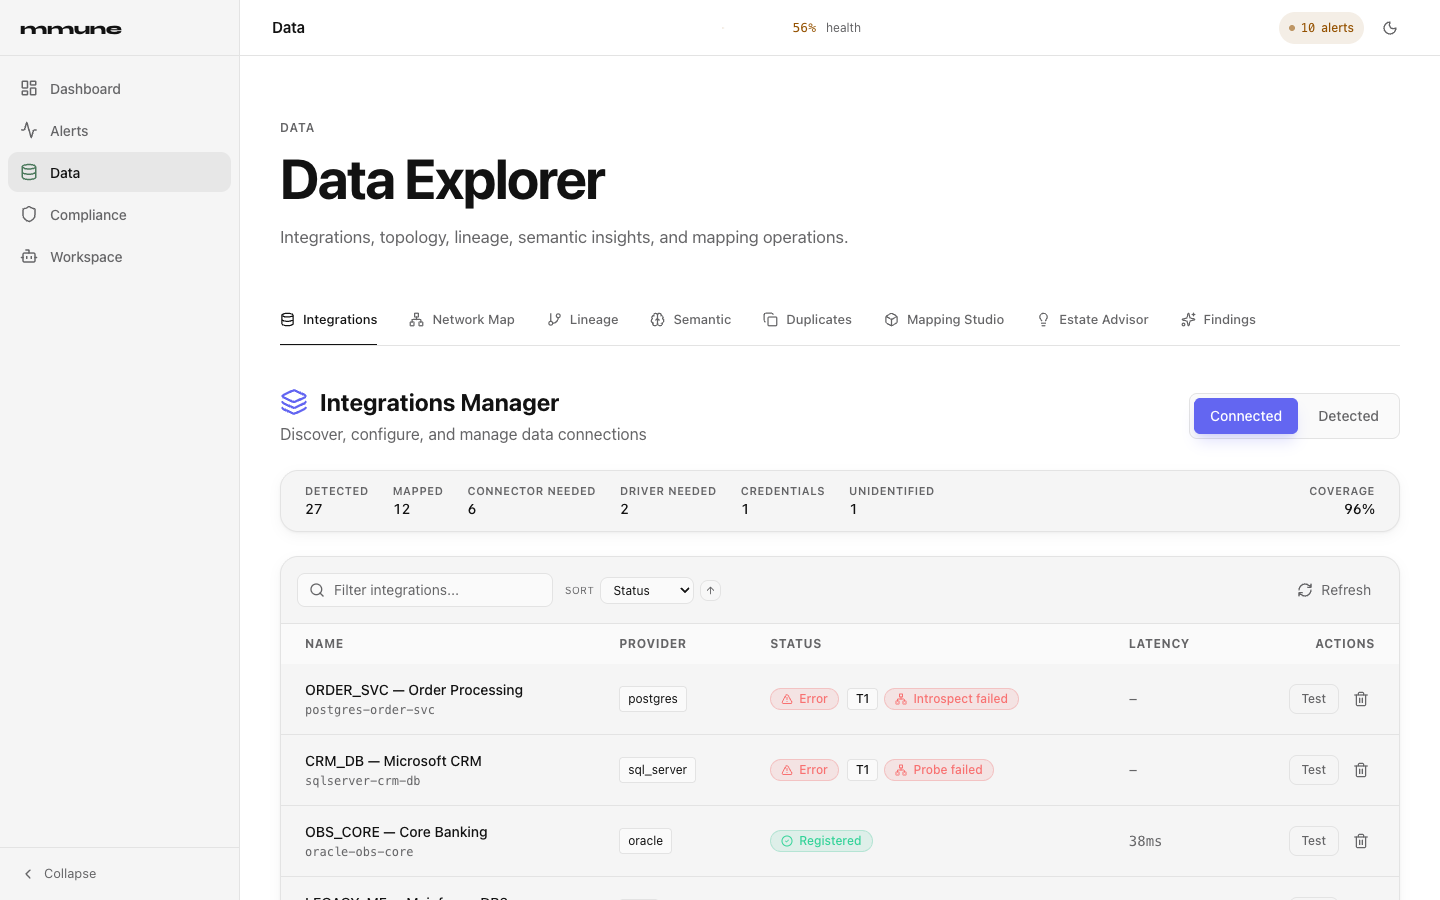
Purpose. List the systems mmune knows about, show how far each has been onboarded, and let you configure, test and register them.
What you see. An Integrations Manager header with a Connected / Detected switch, a coverage summary strip, a toolbar and a table. The table columns are Name (with a slug such as provider-host-port below it), Provider, Status, Latency (Connected only) and Actions. The list refreshes itself every 10 seconds.
Controls.
| Control | Where | What it does |
|---|---|---|
| Connected | switch | Shows integrations with status Registered. This is the default view. |
| Detected | switch | Shows everything found but not yet registered. |
| Start Discovery Scan | Detected toolbar | Starts a discovery scan, then reloads the list after about two seconds. |
| Refresh | Connected toolbar | Reloads the list. |
| Sort | toolbar | Sort by Status (Error first, then Discovered, Configured, Registered) or by Last Seen, ascending or descending. |
| Gear icon | Detected row | Opens Configure Integration (Host, Username, Password) with Cancel and Save Configuration. |
| Refresh icon | Detected row | Tests the connection. Disabled while the row is still Discovered ("Configure credentials before testing"). |
| Plus icon | Detected row | Registers the integration. Disabled until the row is Configured. |
| Test | Connected row | Tests the connection and updates Latency. |
| Trash icon (Disconnect) | Connected row | Asks for confirmation. Disconnect is not available yet. |
Disconnect is not available yet. The integration stays registered and keeps its license seat.
Reading statuses, chips and icons.
| Element | Meaning |
|---|---|
| Discovered (grey, magnifier) | Found by a scan, no credentials yet. |
| Configured (blue, gear) | Credentials saved, or the last test passed. |
| Registered (green, check) | Onboarded and counted against the license. |
| Error (red, triangle) | The last connection test you ran failed. Use the failed_connection_test finding for a lasting record of a failed test. |
| Red pill with an X and "N issues" | Runtime health is Broken: the watchdog, drift, healing or zombie-flow checks found critical problems. |
| Amber pill with a triangle and "N issues" | Runtime health is Degraded. Healthy integrations show no pill. Hover to see the issue titles. |
Grey tier chip (T1 to T4) | Coverage tier of the provider. T1: mmune can introspect it, probe the connection, re-introspect it, and has recorded conformance evidence. T2: introspectable without that evidence. T3: recognised by fingerprint only. T4: neither. |
| Grey "Pending" chip | The endpoint has not been assessed yet. |
| Amber "Connector needed", "Driver needed", "Credentials needed", "Unreachable" | mmune recognises the system but is missing a connector, a database driver, working credentials, or network reach from this deployment. |
| Fuchsia "Unidentified" | Something answers on that port but mmune could not identify it. |
| Grey "Detected only" | Recognised, and not a data source mmune maps. |
| Red "Probe failed", "Introspect failed" | A connection probe or the schema read failed. Hover the chip for the reason and detail. |
| No chip | Coverage state is Mapped, the happy path. |
The coverage summary strip counts Detected, Mapped, Connector needed, Driver needed, Credentials, and Unidentified endpoints, and shows a Coverage percentage. Coverage is 1 minus unidentified divided by detected, and reads "no data" when nothing has been scanned.
Common tasks.
Onboard a newly detected system by hand
- Open Data, then Integrations, and press Detected.
- If the list is empty, press Start Discovery Scan and wait a moment.
- Press the gear icon on the row, enter Host, Username and Password, and press Save Configuration.
- Press the refresh icon to test. Wait for the status to read Configured.
- Press the plus icon. The row moves to the Connected view.
Find out why a system is not being mapped
- Open the Detected or Connected view and look at the chip beside the status badge.
- Hover the chip to read the reason and detail.
- Resolve the cause named by the chip (add credentials, install the driver, or request a connector) and let AutoPilot retry, or test the row again.
API equivalent.
| Action | Method and path |
|---|---|
| Start discovery | POST /api/v1/integrations/discover |
List discovered rows (Detected and Connected both read this; Connected keeps rows whose configuration_state is registered) | GET /api/v1/integrations/discovered |
| Coverage report and summary | GET /api/v1/integrations/coverage |
| Configure | POST /api/v1/integrations/discovered/{id}/configure with {"credentials": {...}} |
| Test | POST /api/v1/integrations/discovered/{id}/test |
| Register | POST /api/v1/integrations/discovered/{id}/register |
| Introspect one or all | POST /api/v1/integrations/discovered/{id}/introspect, POST /api/v1/integrations/introspect-all |
| Supported providers | GET /api/v1/integrations/supported |
bash
curl -X POST "<BASE_URL>/api/v1/integrations/discover" \
  -H "Authorization: Bearer <TOKEN>" \
  -H "Content-Type: application/json" \
  -d '{"hosts": ["<HOST_OR_CIDR>"]}'
The discover, introspect and introspect-all calls return a scan_id. Follow a job with GET /api/v1/discovery/status/{scan_id}.
Network Map tab
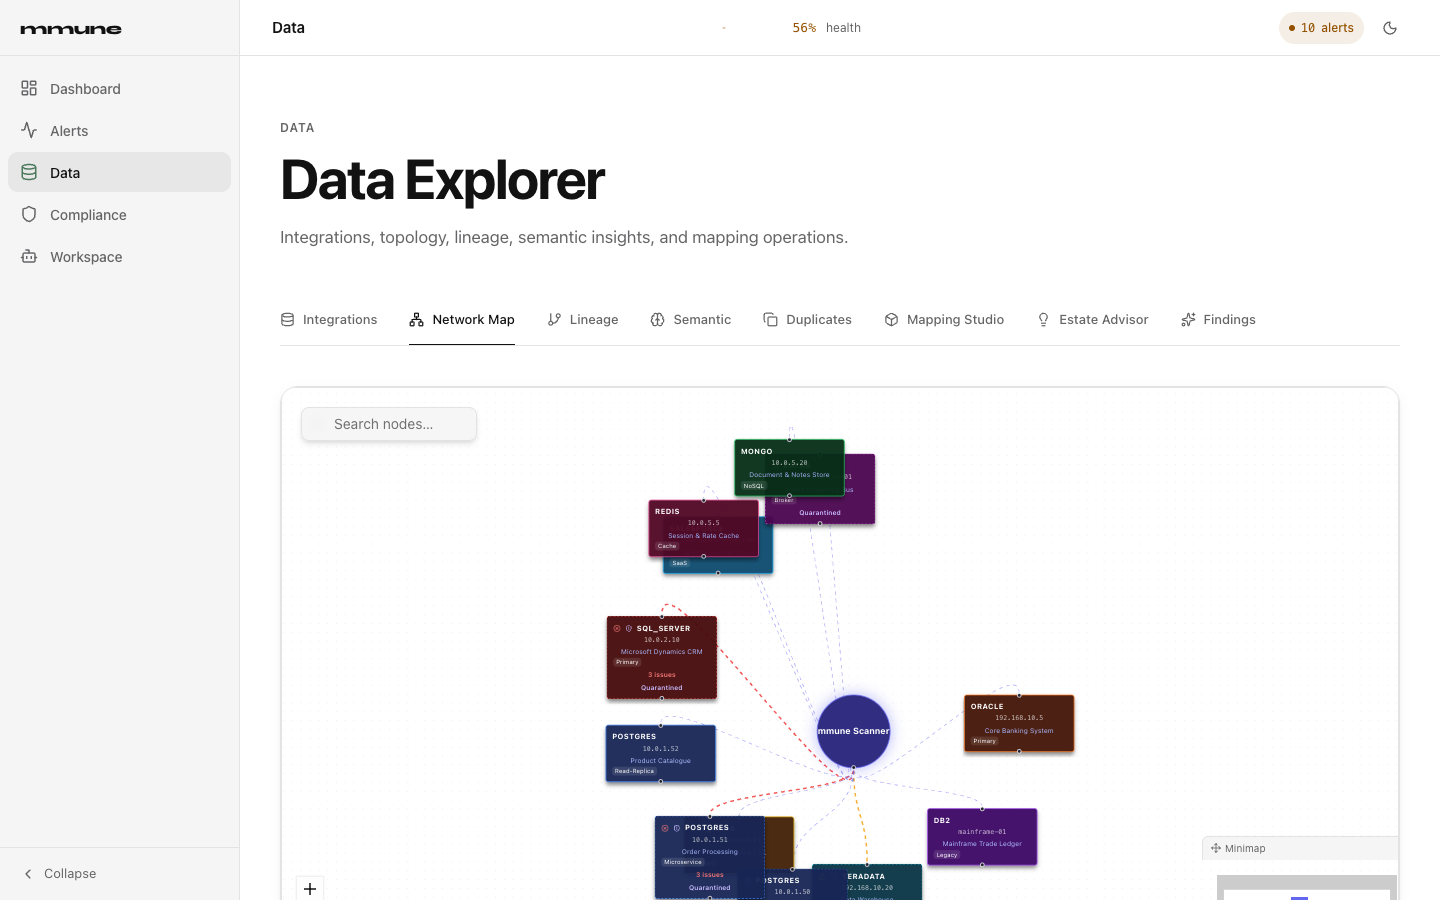
Purpose. See every onboarded integration at a glance and spot which ones are unhealthy.
What you see. A hub node named mmune Scanner in the middle, with one node per registered integration spread around it and an animated line from the hub to each. If nothing is registered yet, the map falls back to the raw discovery schemas. The map refreshes every 5 seconds.
Controls.
| Control | What it does |
|---|---|
| Search nodes box (top left) | Matches provider, host, name, service and role. Non-matching nodes fade to 10 percent, matches get an outline, a match count appears, and the view zooms to the matches. The X button clears it. |
| Drag a node | Moves it. Positions are saved in your browser only. |
| Click a node | Opens the node details drawer on the right. |
| Zoom and fit controls, minimap | Standard pan and zoom. The minimap can be dragged. |
The node details drawer shows, from top to bottom: a Healthy, Degraded or Broken pill and the role; a one-paragraph summary; a Quarantined box if containment has quarantined the node, with the reason and a link to the holding incident; Node Identity (Provider, Host, Role and Service, plus Last Check when a watchdog session exists for the node); System Checks with pass, fail and n/a counts, where each check expands for detail and "Not monitored" marks a check with no data; Watchdog Telemetry (Active or Stopped, Total Checks, Drift Events, Interval); and Issues Detected. Clicking an issue closes the drawer and opens the matching alert in Alerts. Run Health Check tests the live connection and reports "Connection OK" with a response time, or "Health check failed". Close, the X button, a click outside the drawer, or the Escape key dismisses it.
Reading colors and icons.
| Element | Meaning |
|---|---|
| Node border and fill | Provider family only, never health. Examples: Oracle orange, PostgreSQL blue, DB2 purple, MongoDB green, MySQL amber, Redis pink, SAP yellow, Teradata cyan, Kafka and RabbitMQ magenta, Salesforce, ServiceNow and Slack sky blue, S3 teal, REST and GraphQL lime, other HTTP services light blue, anything else slate grey. |
| Red X-circle icon and red "N issues" | Integration health is Broken. |
| Amber triangle icon and amber "N issues" | Integration health is Degraded. |
| Violet icon, dashed border and violet "Quarantined" label | The integration is currently quarantined by containment. |
| Line from the hub | Red #ef4444 (thicker) for Broken, amber #f59e0b (thicker) for Degraded, indigo #6366f1 for Healthy. |
Health is the worst result across four sources: broken connections reported by healing, drift reports, watchdog sessions, and zombie-flow findings. A critical item makes a node Broken, other items make it Degraded.
Common tasks.
Triage an unhealthy integration
- Open the Network Map and look for nodes with a red or amber icon, or red or amber lines.
- Click the node to open the drawer and read the summary and Issues Detected.
- Press Run Health Check to confirm whether the connection works right now.
- Click an issue to jump to its alert in Alerts.
API equivalent. The map reads GET /api/v1/integrations/discovered, GET /api/v1/discovery/schemas, and the health sources GET /api/v1/healing/broken-connections, GET /api/v1/drift/reports, GET /api/v1/watchdog/sessions, GET /api/v1/watchdog/zombies, plus GET /api/v1/containment/marks for quarantine. Run Health Check calls POST /api/v1/healing/connection-health/check.
Lineage tab
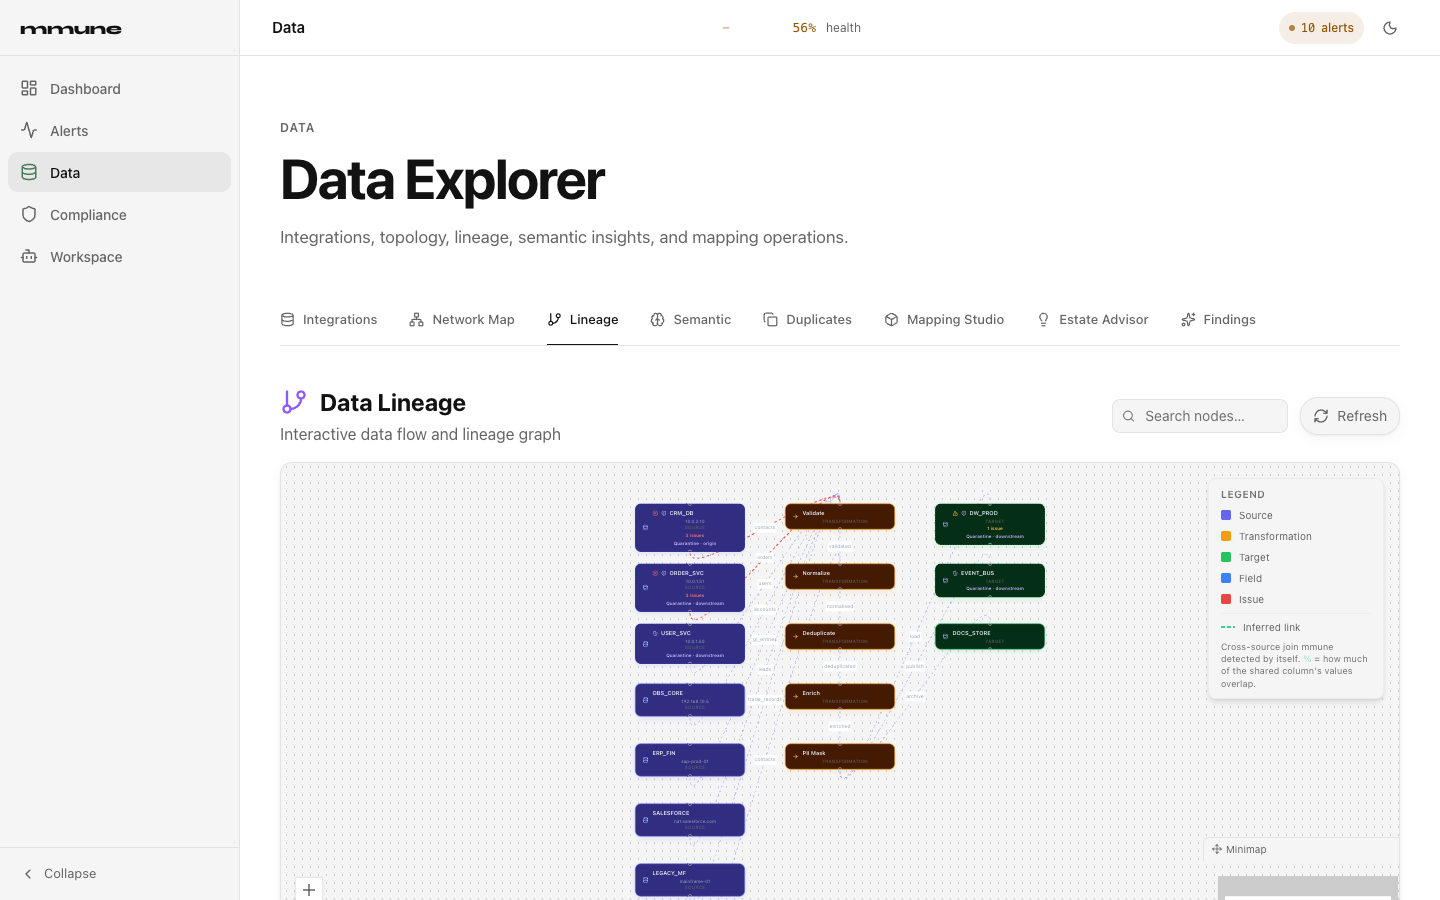
Purpose. Show how data flows from sources through databases and tables, and what is affected downstream if something changes or breaks.
What you see. A Data Lineage header with a search box, a Collapse all / Expand all button, a Refresh button and, once a live update has arrived, an "Updated just now" label. Below it is the graph with a Legend panel at the top right and a minimap. Sources sit on the left, databases next to them, tables to their right. Graphs without database nodes, such as SaaS or sample pipelines, use three columns: sources, transformations, targets.
If the graph is empty you see "No Lineage Data Yet" and a Go to Integrations button. If loading fails you see "Unable to Load Lineage" with the error, a Retry button and a Go to Integrations button.
Controls.
| Control | What it does |
|---|---|
| Search nodes | Matches label, type, id, provider, host and schema. A collapsed database that contains a match opens automatically. A match count is shown. |
| Click a database | Expands or collapses its tables. Databases with more than 8 tables start collapsed, and each shows a table count with a chevron. |
| Collapse all / Expand all | Applies to every database that has tables. |
| Click a table, source or other node | Opens the node details drawer, with Columns (or Key namespaces for Redis), row count, health checks and issues. |
| Refresh | Reloads the graph. The graph also refreshes itself on lineage and health events. |
| Clear impact (X on the banner) | Leaves impact mode. Clicking a table, source or other node does the same. Clicking a database that has tables only expands or collapses it and leaves impact mode on. |
Row counts in the drawer are labelled by how they were obtained. An exact count shows with thousands separators. A catalog estimate shows as "approximately 1.2M". A Redis namespace count comes from a 500-key SCAN sample and is marked as such.
Reading colors, icons and edges.
| Element | Meaning |
|---|---|
| Node border and fill | Node type only, never health. Source and database: indigo. Endpoint and external system: slate grey. Field and column: blue. Transformation, mapping and job: amber. Target: green. TIBCO queue: cyan. TIBCO topic: purple. Table and any other type: dark slate default. |
| Icon inside a node | Database icon for source-like nodes, box for fields, arrow for transformations. |
| Red X-circle icon with red "N issues" | The node's health is Broken. |
| Amber triangle icon with amber "N issues" | The node's health is Degraded. |
| Violet "Quarantine" line and dashed border | Containment has quarantined the node. |
| Solid indigo edge | A declared edge, such as a database containing a table or a mapping step. The label shows the edge type. |
| Red or amber edge | The edge's source node is Broken (red) or Degraded (amber). Edge color follows source-node health. |
| Dashed emerald edge labelled "≈ column · NN%" | An inferred link: mmune found a cross-source join by itself. The column is the shared column and NN% is how much of that column's values overlap between the two tables. A broken or degraded source turns it red or amber. |
| Dashed emerald edge labelled "≈ N links" | With databases collapsed, all inferred links between the same two visible nodes are rolled up into one edge. Expand the databases to see the per-table links. |
Impact mode starts when you arrive with a focusNodeId, for example from a Findings row or an alert's Lineage link. The camera frames that node and pulses an outline on it. Every node downstream gets an outline that fades with distance, everything else dims, and the edges on the downstream path turn indigo. A pill reads "Impact from X: N systems / M tables affected" (or "nodes" when the graph has no table nodes). The pill is indigo for 3 or fewer affected nodes, amber for 4 to 10, and red above 10.
Common tasks.
Find what depends on a table
- Open Lineage and type the table name in Search nodes.
- Click the table's node, or open
/data?tab=lineage&focusNodeId=<NODE_KEY>directly. - Read the impact pill and follow the highlighted nodes to the right.
- Press the X on the pill to return to the full graph.
Understand an inferred link
- Look for dashed emerald edges.
- Read the label for the shared column and the overlap percentage.
- Click the nodes at both ends to inspect their columns.
API equivalent. GET /api/v1/lineage/graph returns nodes and edges. GET /api/v1/lineage/impact/{node_key} returns the downstream blast radius (affected_nodes, edges, truncated) and accepts a max_depth query parameter, default 50, capped at 200. To add an edge yourself, call POST /api/v1/lineage/edge with source, target, edge_type and optional metadata.
Existing registrations do not appear in lineage retroactively. A source node is created when an integration is registered, and table nodes appear after introspection. Re-register or re-introspect an integration that was onboarded before its lineage was recorded.
Semantic tab
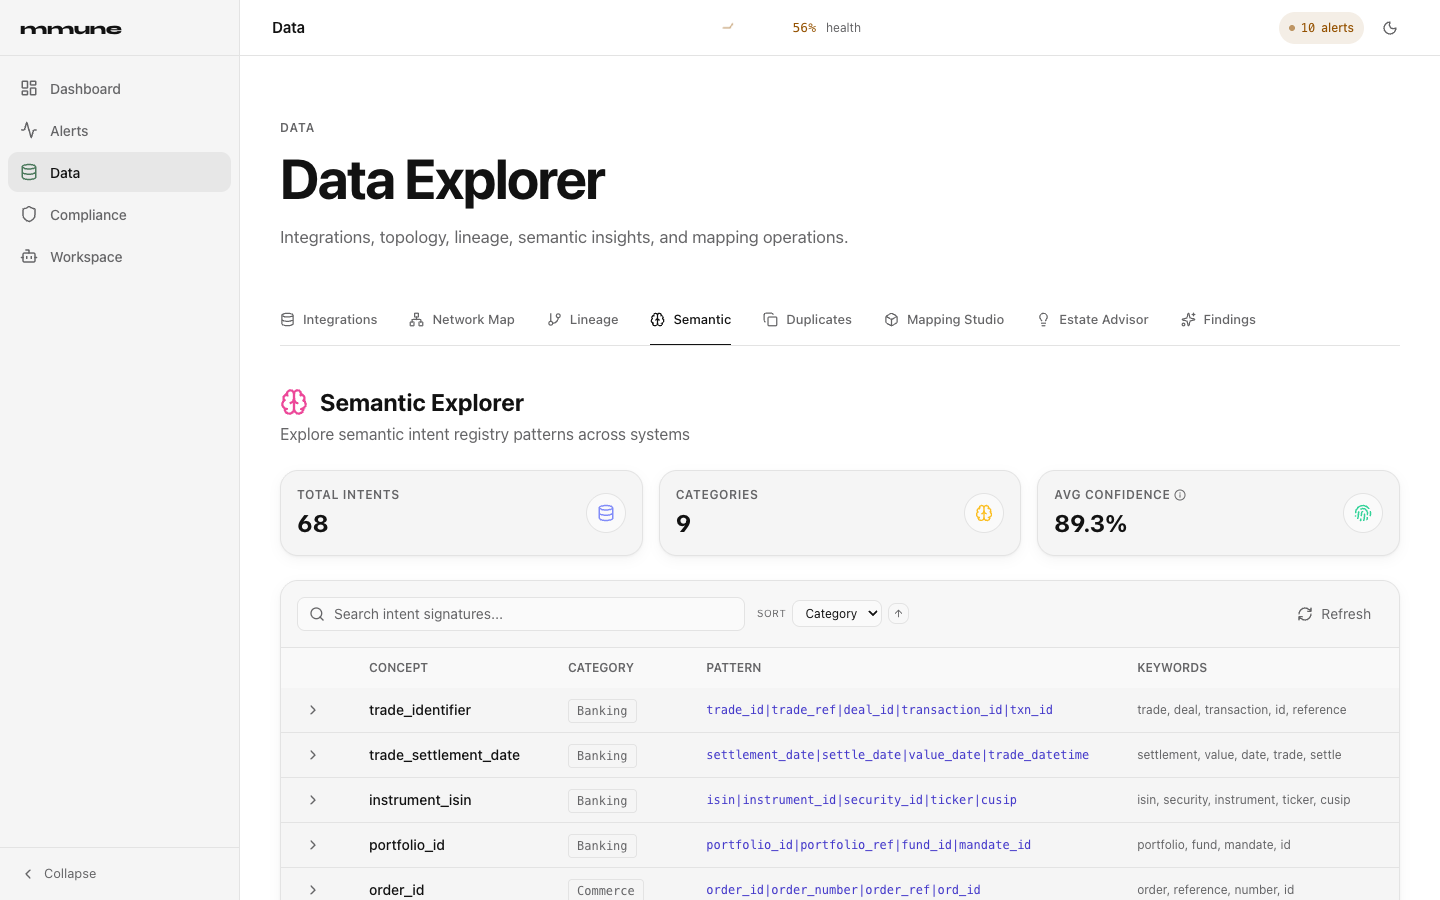
Purpose. Show the business meaning mmune has assigned to fields across your systems, grouped by concept, and which systems hold fields with that meaning.
What you see. Three stat cards (Total Intents, Categories, Avg Confidence), then a searchable table with the columns Concept, Category, Pattern and Keywords. This is a registry of intents, not a list of every column mapping. Each row is built from the semantic mappings stored for your organization, which AutoPilot writes during introspection.
The Avg Confidence card has an info icon. Hover it for the rule: pattern matching on field names contributes 30 percent, AI analysis of name, description and samples contributes 70 percent, and if the pattern score alone is 80 percent or higher the AI step is skipped and the pattern score is used.
Controls.
| Control | What it does |
|---|---|
| Search intent signatures | Filters by concept, category or field-name pattern. |
| Sort | By Category or Concept, ascending or descending. |
| Refresh | Reloads stats and signatures. |
| Click a row | Expands it to list the systems with matching fields. Each system shows its name, provider, a status chip and the matched fields as table.field. |
If the registry is empty, the page says "No semantic mappings yet" and explains that it fills in as integrations are introspected. A search with no results says "No matching concepts".
Reading the page. Category chips are monospace labels. Status chips in the expanded row are green and read registered. Matched fields are de-duplicated and sorted.
Common tasks.
See where "email" style fields live
- Open
/data#semantic. - Type the concept or field pattern into the search box.
- Click the matching row.
- Read the systems and
table.fieldentries listed under "Systems with matching fields".
API equivalent. GET /api/v1/semantic/stats, GET /api/v1/semantic/signatures, and GET /api/v1/semantic/signatures/{signature_hash}/matches.
Duplicates tab
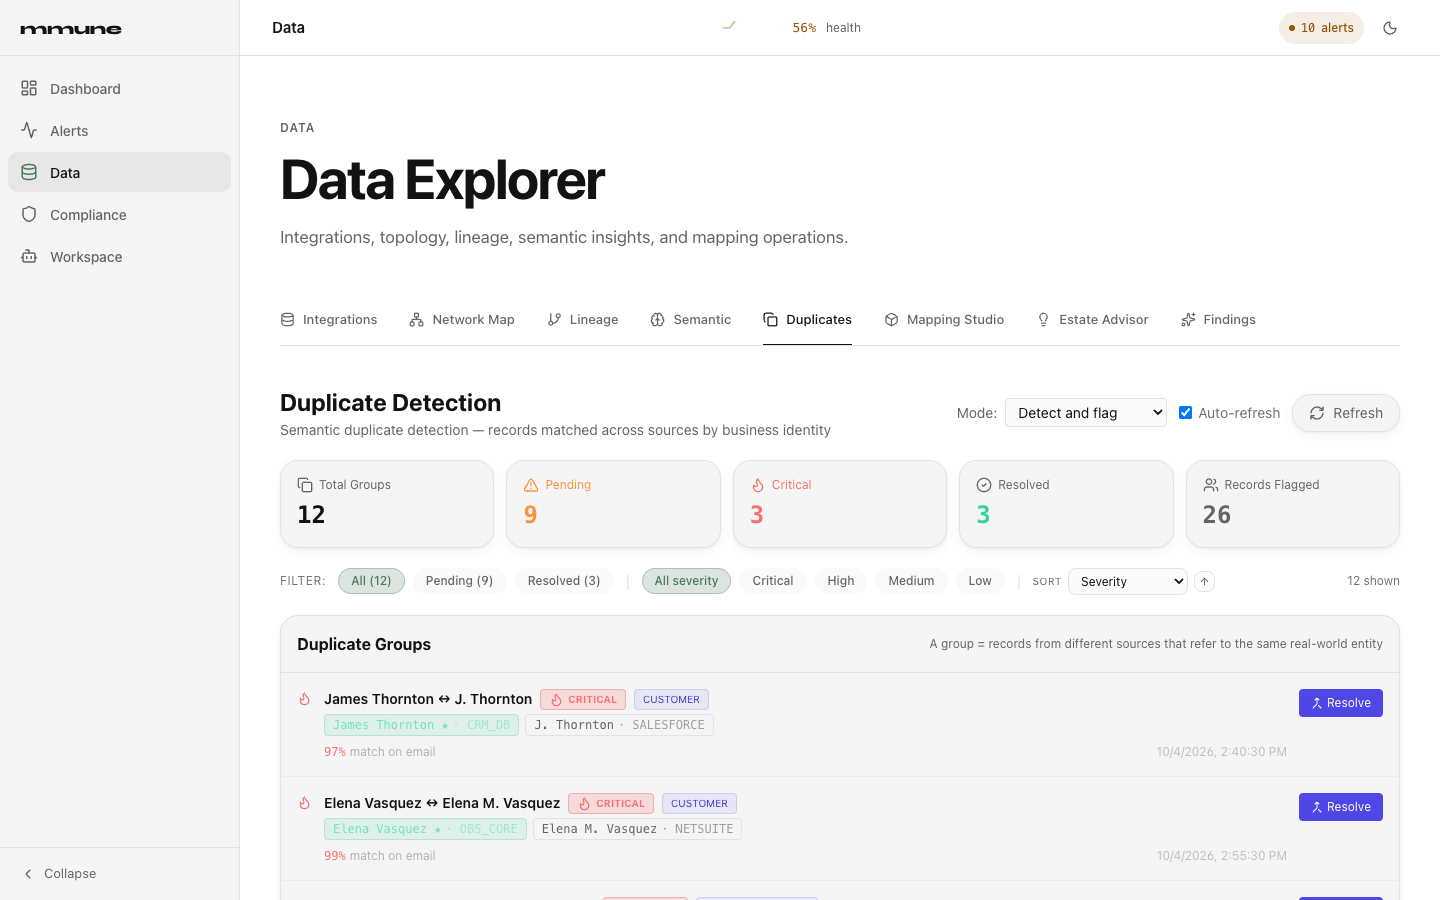
Purpose. Review groups of records from different sources that appear to describe the same real-world entity, and record what was decided about each.
What you see. A Duplicate Detection header with a Mode selector, an Auto-refresh checkbox and a Refresh button. Five stat tiles follow (Total Groups, Pending, Critical, Resolved, Records Flagged), then filter chips and the Duplicate Groups list. The list refreshes every 15 seconds while Auto-refresh is on.
Each group row shows a title built from the record names and sources, a severity badge, the business intent if known, the member records (the primary record has a star), a similarity score for each pair with the field the match was made on, and the detection time. Unresolved groups have a Resolve button. Resolved groups are dimmed, show a green check and read "Resolved" with the action taken.
Controls.
| Control | What it does |
|---|---|
| Mode | "Detect and flag" (flag) or "Block before target" (block). Saving shows a green "Saved". The setting returns to the configured default after a restart. |
| Auto-refresh | Polls the group list every 15 seconds. |
| Refresh | Reloads the list. |
| All, Pending, Resolved | Status filter, each with a count. |
| All severity, Critical, High, Medium, Low | Severity filter. Several severities can be on at once. |
| Sort | By Severity or Date Detected. |
| Resolve | Opens the Resolve Duplicate Group dialog. |
In the dialog, Action offers "Merge into primary record" (merged), "Keep separate (false positive)" (kept_separate), "Delete duplicates" (deleted) and "Ignore (suppress future alerts)" (ignored). Primary Record lets you pick which record is the one to keep. Confirm saves, Cancel closes. Resolving records your decision against the group. It does not edit data in the source systems.
Reading severity and scores. Severity comes from the group, or from the highest pair similarity when the group has none: 95 percent or more is Critical (red), 85 to 94 is High (orange), 70 to 84 is Medium (yellow), below 70 is Low (blue). Score text uses the same colors.
Where groups come from. The list shows groups the backend currently knows about. They are created by POST /api/v1/duplicates/detect on a record set you supply, and, if MMUNE_AUTO_DUPLICATE_SCAN is set to true on the backend, by an opt-in sampler. The sampler takes a capped sample of rows (200 by default, 1000 at most) from the most identity-like table of a newly discovered PostgreSQL or MySQL integration. Without either, the tab stays empty. Duplicate groups are not retained across a restart.
Common tasks.
Resolve a false positive
- Open
/data#duplicatesand press the Pending filter. - Find the group, read the records and match fields, and press Resolve.
- Choose "Keep separate (false positive)" and select a Primary Record.
- Press Confirm. The group moves to Resolved.
Change how duplicates are treated
- Use the Mode selector to pick "Detect and flag" or "Block before target".
- Wait for the green "Saved" note.
API equivalent. GET /api/v1/duplicates/groups (optional resolved=true|false), POST /api/v1/duplicates/resolve (group_id, primary_record_id, action, optional resolved_by, notes), GET /api/v1/duplicates/config and PUT /api/v1/duplicates/config ({"mode": "flag"} or {"mode": "block"}), and POST /api/v1/duplicates/detect.
Mapping Studio tab
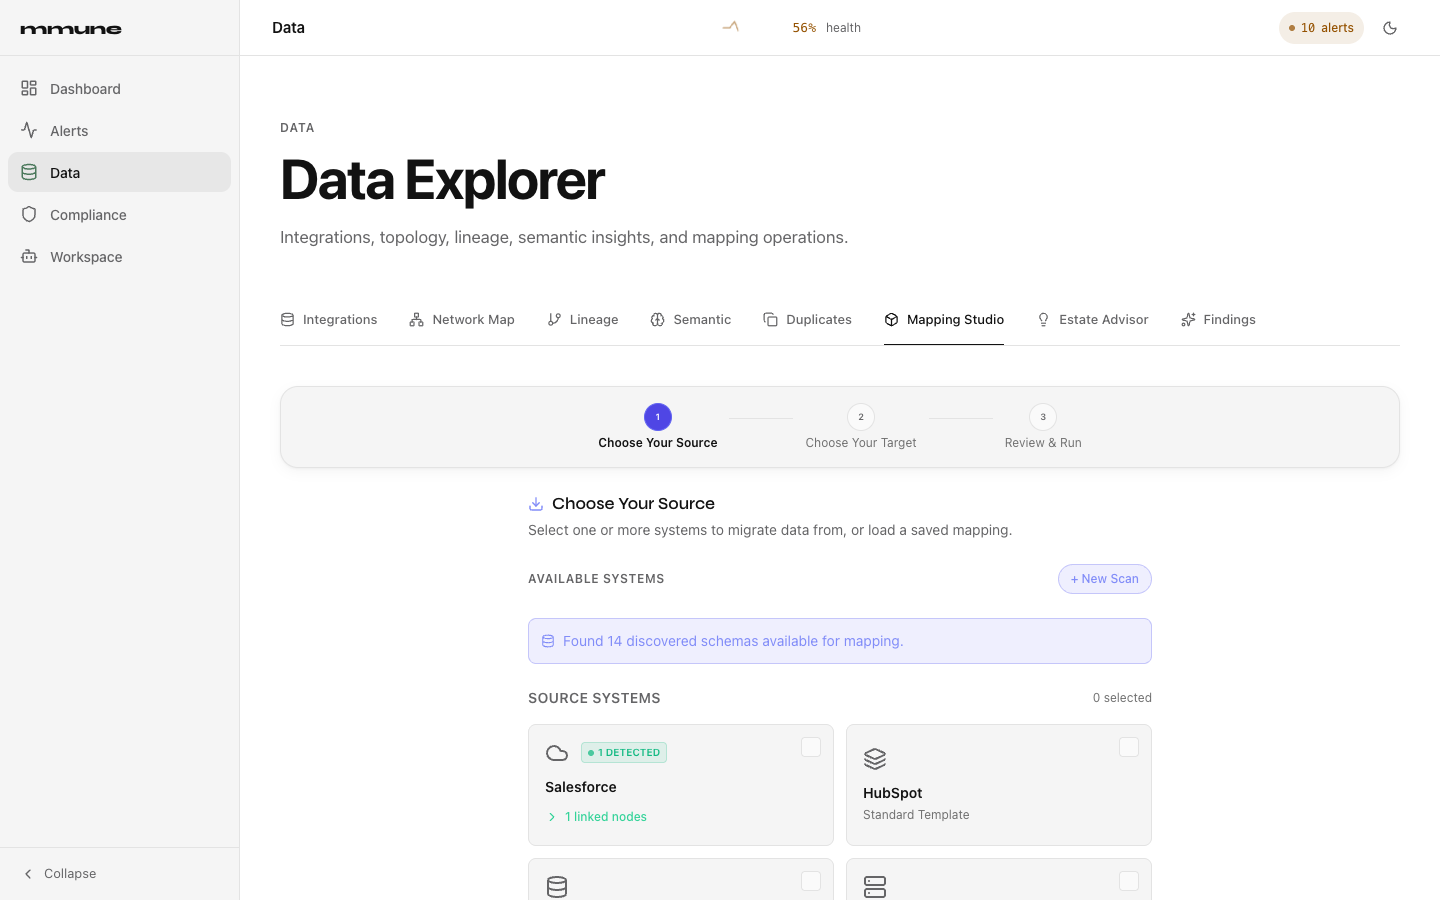
Purpose. A three-step wizard that maps a source system's fields onto a canonical or destination schema using AI, and reloads mappings you have saved before.
What you see. A step indicator (Choose Your Source, Choose Your Target, Review & Run) above a content area and a Back / Next bar.
Step 1, Choose Your Source, lists Available Systems. It shows the standard vendors Salesforce, HubSpot, Pipedrive and Zoho CRM plus any systems found by discovery, grouped by provider, with a "detected" badge and linked nodes where discovery found some. A notice says how many discovered schemas are available. Select one or more systems. Below are Saved Mappings (click one to load it) and an "Advanced: Manual input override" JSON editor.
Step 2, Choose Your Target, has a Target System selector: "Universal Customer (Canonical Only)" or one of Odoo ERP, NetSuite, Microsoft Dynamics 365, SAP S/4HANA, Workday. A card confirms the source you chose.
Step 3, Review & Run, shows From and To, any pre-loaded AI Field Mappings with an overall confidence percentage and a per-field percentage, Semantic Understanding for the first three fields, and, after a run, the mapped result, the source system, an ID and a Raw JSON toggle. Errors show as "Mapping failed".
Controls.
| Control | What it does |
|---|---|
| + New Scan | Opens a Target Network / Host box. Enter a host or CIDR range and press Scan (or Enter). Leaving it empty runs the scan with no target. |
| Source system cards | Select or clear a source. Next stays disabled until a source is selected or manual JSON is present. |
| Saved Mappings, Refresh | Lists saved mapping files. Click one to load it. Selecting a vendor auto-loads that vendor's saved mapping if one exists. |
| Advanced: Manual input override | A JSON editor whose content replaces the sample input for the run. |
| Next: Choose Target, Next: Review & Run, Back | Move between steps. |
| Run Migration | Maps the input, then runs the Guardian check when Guardian is active, then shows the result. |
Saved mapping badges are derived from the file name: CRM for Salesforce or HubSpot, ERP for NetSuite or ERP, HR for Workday or HR, DB otherwise.
What Run Migration actually does. It maps one record. If you gave no manual JSON, the console builds a small built-in sample customer record from the selected vendor and maps that. The result is shown on the page and the mapping is saved on the server, which is where Saved Mappings comes from. Run Migration does not copy data into a destination system. If the mapping call fails, the console falls back to a local rule-based mapping. A failed validation or Guardian check stops the run.
Reading the page. Step bubbles are indigo for the active step, green with a check for completed steps and grey for upcoming ones. Confidence shows as a purple pill. A green "N detected" badge and an "N linked nodes" line on a source card mean discovery found matching systems; click the line to list them. Cards with no detections read "Standard Template".
Common tasks.
Map a source and review the result
- Open
/data#mapping. - Select one or more systems, then press Next: Choose Target.
- Pick a Target System, then press Next: Review & Run.
- Press Run Migration and wait for the result card.
- Open Raw JSON to see the full mapping output.
Reload an earlier mapping
- On step 1, find the file under Saved Mappings.
- Click it. Go to step 3 to see its AI Field Mappings.
API equivalent. POST /api/v1/mapping/map runs a mapping (body fields vendorId, vendorName, objectType, rawData, metadata). To choose a target model from the API, pass target_model as a query parameter. GET /api/v1/mapping/saved lists stored mappings and GET /api/v1/mapping/saved/{filename} returns one. GET /api/v1/discovery/schemas supplies the discovered systems. POST /api/v1/discovery/scan (body {"target": "<HOST_OR_CIDR>"}) starts the scan behind + New Scan, and GET /api/v1/discovery/status/{scan_id} follows it. POST /api/v1/mapping/suggest returns mapping suggestions.
Estate Advisor tab
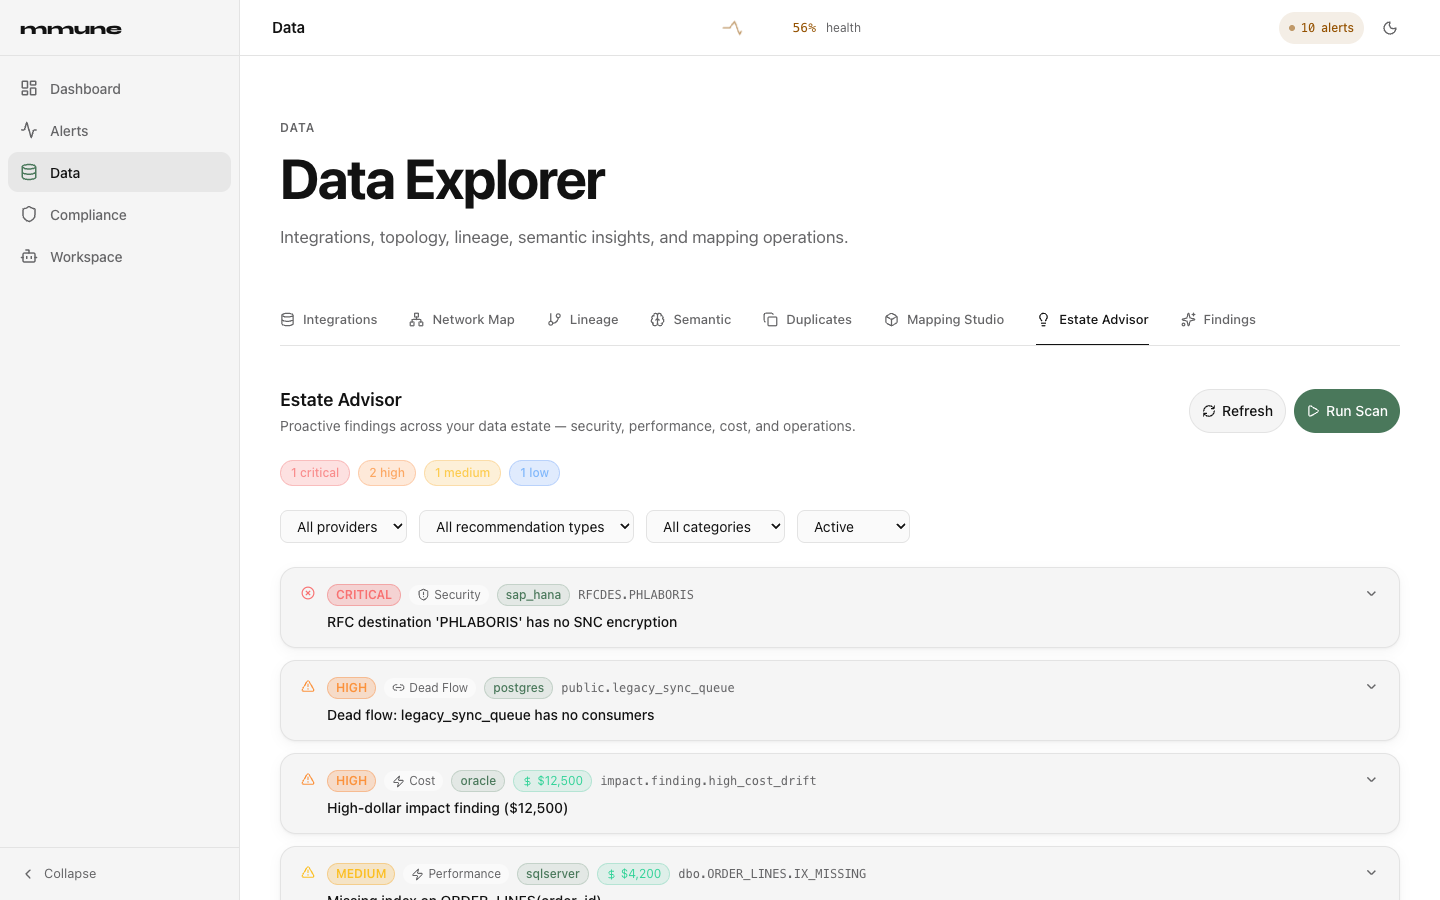
Purpose. List proactive recommendations about your estate, such as security, performance, cost and dead data flows, and let you work them to resolved or dismissed.
What you see. A header with Refresh and Run Scan buttons, severity count chips, four filter dropdowns, and a list of recommendation cards sorted from critical to low. Cards are collapsed by default. With no matches you see "No active recommendations" and a prompt to run a scan.
A collapsed card shows a severity badge, a type chip, the provider, an optional green dollar chip (hover for its assumptions), the entity name in monospace and the title. Expand it to read the description, a Suggested Action box, an Impact estimate ("Estimated cost: $N") when one exists, a collapsible Evidence block in JSON, and a footer with Confidence, Source and Detected time.
Controls.
| Control | What it does |
|---|---|
| Run Scan | Runs the advisor over registered and configured integrations. If a provider is selected in the dropdown, only that provider is scanned. A green message such as "Scan complete: N new finding(s)" appears. |
| Refresh | Reloads the list. |
| Severity chips | Show the count for each severity. Click one to filter, click again to clear. |
| All providers | sap_hana, postgres, sqlserver, oracle, mysql, mongodb. |
| All recommendation types and All categories | The same ten values: security, integration, deployment, performance, code, index, query pattern, dead flow, cost, modernization. |
| Status | Active (default), Dismissed or Resolved. |
| Resolve, Dismiss | On an expanded card. The card leaves the current list. |
Reading severity. Critical is red with an X-circle icon, High is orange with a triangle, Medium is amber with a triangle, and Low is blue with a check-circle icon. The chip beside the severity names the type, with a shield for security, a link for integration and dead flow, a bolt for performance and cost, and a chip icon for the rest.
An empty tab can also mean recommendations could not be read. If you expect results and see none, ask your administrator to check the backend logs.
Common tasks.
Run a scan and work the results
- Open
/data#recommendations. - Optionally choose a provider, then press Run Scan.
- Click the Critical chip to see the most urgent items.
- Expand a card, read the Suggested Action and Evidence, and act on it in the affected system.
- Press Resolve when it is fixed, or Dismiss if it does not apply.
Review what you dismissed
- Set Status to Dismissed.
- Expand a card to read it again.
API equivalent. GET /api/v1/recommendations with optional integration_id, provider, recommendation_type (or the older category), severity, status and limit (default 200, maximum 500). Status defaults to active. POST /api/v1/recommendations/scan with optional integration_id, provider and analyzer_types. PATCH /api/v1/recommendations/{id} with {"status": "active" | "dismissed" | "resolved"}.
Findings tab
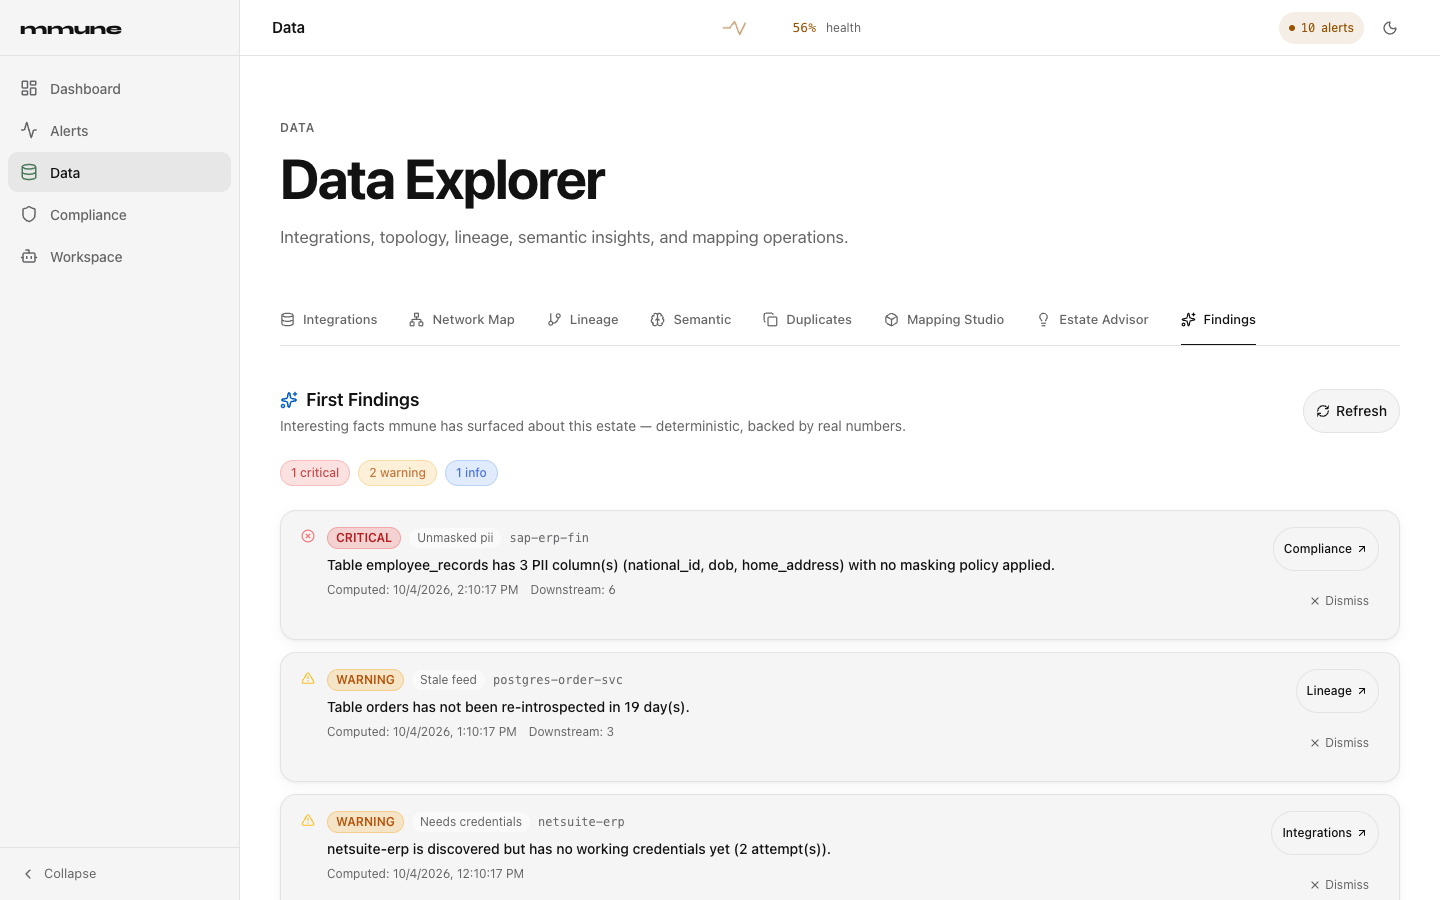
Purpose. Show the short list of plain facts mmune has worked out about your estate, each backed by real numbers, so you know where to look first.
What you see. A First Findings header with a Refresh button, severity count chips, and a list of findings sorted critical, then warning, then info. Each row shows a severity badge, a kind label (for example "Unmasked pii"), the integration id, a one-sentence statement, the time it was computed, and, where known, an impact tier with a downstream count. On the right are a link button and Dismiss.
Findings are deterministic. They come from the records AutoPilot already fills, and no AI model is needed to produce them. They are recomputed on every AutoPilot pass and after a forced re-introspection, so with AutoPilot off this tab can stay empty. With no findings you see "mmune is still learning this estate" and a count of integrations discovered and tables introspected so far.
Controls.
| Control | What it does |
|---|---|
| Severity chips | Filter to Critical, Warning or Info. Click again to clear. |
| Link button (Lineage, Integrations, Compliance or Data Explorer) | Jumps to where you can look further. Findings tied to a table open Lineage focused on that node. Integration findings open Integrations. Unmasked PII opens Compliance. |
| Dismiss | Removes the finding. It stays dismissed when findings are recomputed. |
| Refresh | Reloads the list. |
Finding kinds and severities.
| Kind | Severity | Meaning |
|---|---|---|
failed_connection_test | Critical | A connection test for the integration failed. |
unmasked_pii | Critical | A column flagged as PII has no masking policy applied. |
unidentified_integration | Warning | Something answers but mmune could not identify it. |
needs_connector | Warning | Identified, but mmune has no connector for it yet. |
needs_credentials | Warning | Onboarding is blocked until credentials are supplied. |
stale_feed | Warning | A table has not been re-introspected in 14 days or more. |
orphan_table | Info | A table has no downstream lineage consumers. |
empty_table | Info | A table has zero rows, or appears empty if the count is an estimate. |
large_table | Info | A table has 10,000,000 rows or more. |
Ranking is by severity, then by blast radius (the number of downstream nodes), then by recency.
Common tasks.
Triage the top findings
- Open
/data#findings. - Read the Critical findings first and note the integration and statement.
- Press the link button to open the related Lineage, Integrations or Compliance view.
- Fix the cause, or press Dismiss if the finding is expected.
API equivalent. GET /api/v1/discovery/first-findings (limit from 1 to 500, default 50; the console asks for 200) returns findings, count and estate_summary. POST /api/v1/discovery/first-findings/{finding_id}/dismiss dismisses one finding and requires the write permission.
Tables tab
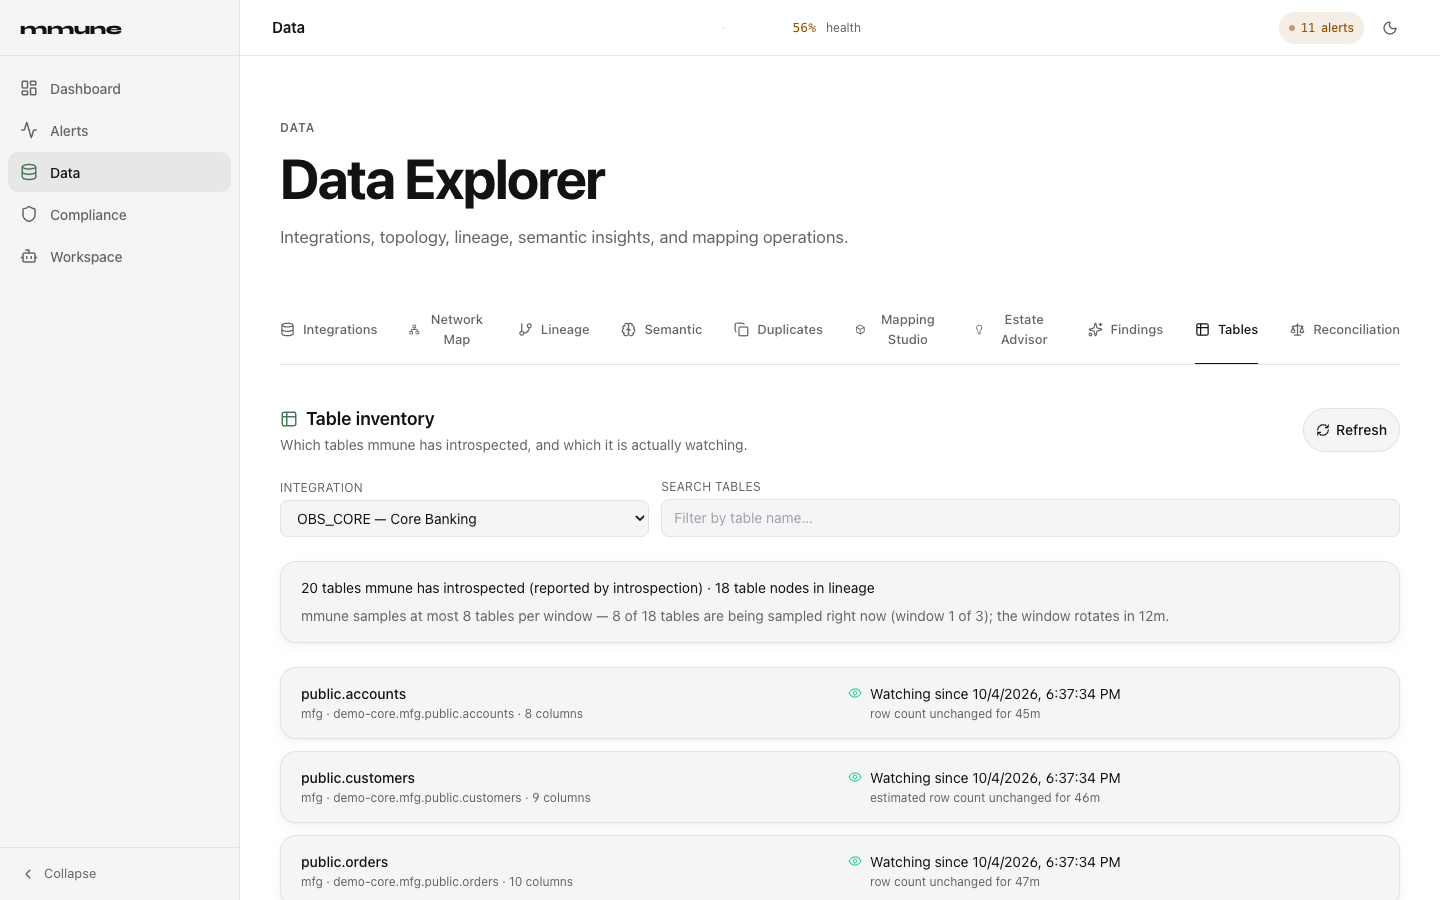
Purpose. Show, for one registered integration, which tables mmune has introspected and which of them it is actually watching for row-count changes.
What you see. A Table inventory header with a Refresh button, an Integration selector and a Search tables box. Under them is a summary card with two lines. The first gives the counts, for example "20 tables mmune has introspected (reported by introspection) · 18 table nodes in lineage". When the two numbers match, it shows only the introspected count. If introspection recorded no count, it reads "not recorded". The second line describes sampling coverage, for example mmune samples at most 8 tables per window — 8 of 18 tables are being sampled right now (window 1 of 3); the window rotates in 12m.
Below the summary is one card per table. Each card shows the table as schema.table, then the database, the lineage node key and the column count, and on the right the watch status. The list holds 50 tables per page, with a "showing 1 to 50 of N" line and Previous and Next buttons.
If no integration is registered, the tab says "No registered integrations yet" and points you to the Integrations tab. If the chosen integration has no introspected tables, it says "mmune has not introspected any tables for this integration yet."
This tab reads only mmune's own lineage and discovery records. It never queries your database.
Controls.
| Control | What it does |
|---|---|
| Integration | Chooses which registered integration to list. The first one is selected on load. |
| Search tables | Filters the list. It waits about 300 milliseconds after you stop typing, then returns to the first page. The term is matched against the table's full lineage node key, so a term that appears in the integration id or database name also matches. |
| Previous, Next | Move through pages of 50 tables. |
| Refresh | Reloads the current page. |
Reading watch status.
| Status | Meaning |
|---|---|
| Watching since (date and time), green eye | The sampler is watching the table and has a baseline. A second line reads "row count unchanged for" a duration, or "estimated row count unchanged for" when the count is an estimate. |
| Watched, no baseline yet, amber hourglass | The table is in scope for sampling, but no baseline has been recorded. |
| Not sampled in this window, grey crossed eye | The table is not being sampled right now. A second line gives the reason when one is known. |
The reasons shown under Not sampled are: row-count sampling does not support this provider, row-count sampling is turned off, this integration is not being watched, mmune reaches this integration through an agent and not directly, and outside the current sampling window.
The time after "Watching since" is when the sampler first saw the table's row count. It is not the time of an observed change. After a restart, tables read "Watched, no baseline yet" until the sampler runs again. The sampler covers a limited number of tables per window and rotates through the rest, which is why a large estate shows only part of its tables as watched at any moment.
Common tasks.
Check whether a table is being watched
- Open
/data#tables. - Choose the integration in the Integration selector.
- Type part of the table name into Search tables.
- Read the status on the right of the card. If it says Not sampled, read the reason beneath it.
See how much of an estate is covered
- Choose the integration.
- Read the second line of the summary card to see how many tables are sampled now and when the window rotates.
- Press Refresh after the rotation time to see a different set of tables marked as watched.
API equivalent. GET /api/v1/integrations/{integration_id}/tables with optional limit (1 to 200, default 50, and the console uses 50), offset and q (up to 200 characters, matched against the whole lineage node key). It returns databases, tables_introspected_total, table_nodes_in_lineage, total, tables (each with a watch object) and watch_window. An unknown integration id returns HTTP 404. The Integration selector is filled from the registered integrations list.
Reconciliation tab
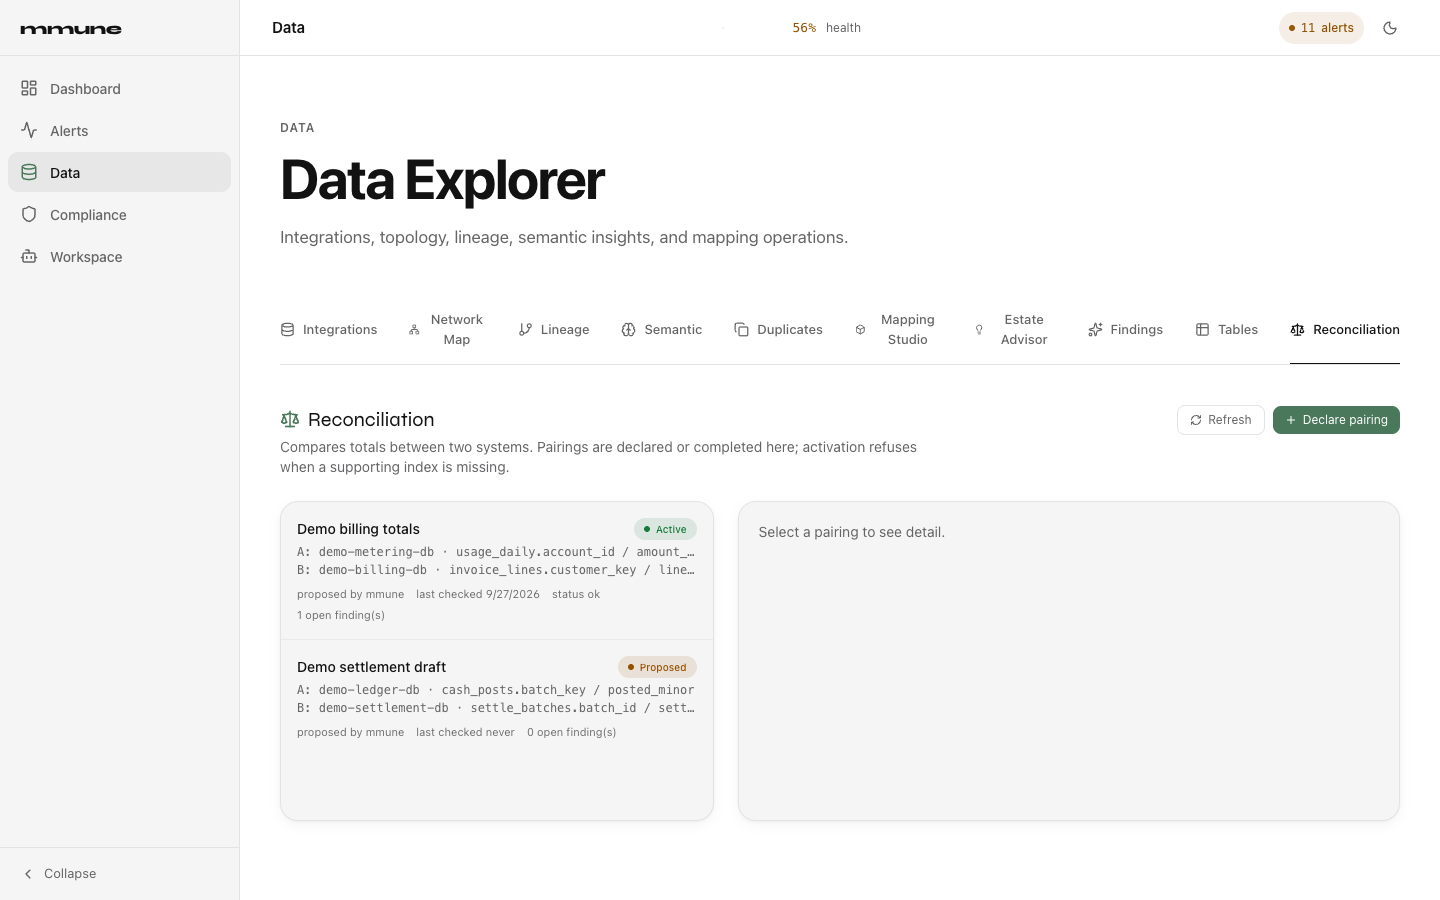
Purpose. Compare the same business totals held in two different systems, for example usage in a metering database against lines in a billing database, and raise a finding when they stop agreeing. A pairing is one declared comparison between a table in system A and a table in system B.
What you see. A Reconciliation header with the line "Compares totals between two systems. Pairings are declared or completed here; activation refuses when a supporting index is missing." On the right are Refresh and Declare pairing. Declare pairing appears only for users with the write permission.
The left panel lists the pairings. Each shows the name, a status chip, an A line and a B line in the form integration · table.key / measure, who proposed it ("proposed by mmune", or "proposed by" followed by the email address or user id of the person who declared it), when it was last checked, the last check status, and the number of open findings. The right panel reads "Select a pairing to see detail" until you click one.
The detail panel shows, from top to bottom: the name and status, the action buttons, any error from the last action, an Index check line, the Spec, a Partitions table, and for Proposed and Paused pairings a "Complete / edit proposal" form.
How the comparison works. mmune asks each system for per-partition totals, a row count and a sum of the measure column, and compares those. Only the totals travel to mmune. When a settled partition disagrees, mmune can fetch key and amount rows for that one partition into memory, up to the Tier B row cap (default 100,000 per side), to say which keys are missing or differ. Those rows are compared and discarded. They are never stored or shown. For eligible partitions over that cap, mmune takes a further step: each system computes a keyed fingerprint of every key and returns only the fingerprints beside integer amounts, bounded by the Tier B fingerprint row cap. Partitions over the applicable cap report totals only. Findings show the partition value and a lookup SQL statement you can run yourself in each system, and never show record-level keys or amounts.
Controls.
| Control | Where | What it does |
|---|---|---|
| Declare pairing | header, write only | Opens the Declare a pairing form. Create proposed pairing saves it with status Proposed. Cancel closes the form. |
| Refresh | header | Reloads the list and the open detail. |
| Pairing row | left panel | Opens the detail on the right. |
| Activate | detail, Proposed or Paused, write only | Asks for confirmation, checks the pairing is complete and that supporting indexes exist, then makes it Active. |
| Pause | detail, Active, write only | Stops checking. The pairing becomes Paused. |
| Reject | detail, Proposed or Paused, write only | Marks the pairing Rejected. |
| Save changes | edit form, Proposed or Paused, write only | Saves edits to the spec. |
The declare and edit forms take the same fields: the name; the integration id, database, schema, table, key column and measure column for each side; the measure scale for each side (0 to 6); the minor unit exponent (0 to 6) and currency; the partition columns and partition value type; the timestamp column and its kind (utc or source_local); the settle window in seconds; the cadence in seconds (at least 60); tolerances per partition and per key in minor units; lookback partitions and days; the Tier B row cap and fingerprint row cap; and an optional key normalizer.
The Declare form pre-fills the fingerprint row cap with 1000000. A pairing created through the API without that field uses 100,000.
Reading statuses.
| Status | Meaning |
|---|---|
| Proposed (amber) | Declared by a person or proposed by mmune, and not yet running. It can be edited, activated or rejected. |
| Active (green) | Being compared on its cadence. It can only be paused. |
| Paused (amber) | Stopped. It can be edited, activated again or rejected. |
| Rejected (red) | Final. No further changes are allowed. |
| N open finding(s) | Disagreements found by checks that have not been resolved. |
A pairing becomes Active only when a person activates it. Nothing activates automatically.
A reconciliation finding is attributed to the receiving system, not the source system, so you may see it under a different integration than the one you expect.
In the Partitions table, each row shows the partition value and a reference, the last activity on side A, the row count and the total on each side, and the difference (Δ) in count and total. Totals are shown in major units using the minor unit exponent. A dash means no value yet. Settled reads "settled" or "in-flight", and only settled partitions are judged. Agrees reads yes, no, or a dash when it has not been judged. The Index check line reads "Supporting indexes present on both sides.", "No index check recorded yet.", or names the side that lacks one.
When activation is refused. Activation fails with an error in the detail panel in these cases.
- A required field is missing. Activation needs both partition columns, the A timestamp column, a settle window, both measure scales, a cadence of at least 60 seconds, and valid lookback values. The API answers HTTP 422 with code
activation_incompleteand lists the problems. - A supporting index is missing on one side. The API answers HTTP 409 with code
index_check_failed, and the console adds the note "There is no override: add a supporting index (or a replica that already has one) on the missing side, then activate again." The refusal is recorded in Index check. Add the index, or point the side at a replica that has one, and activate again. - mmune holds no credentials for one of the sources. The API answers HTTP 409 with code
missing_source_credentials.
Declaring a pairing also fails with HTTP 422 when a table or column is not in mmune's lineage catalog, so introspect both integrations first. A database name is required on each side for this check.
Common tasks.
Declare and activate a pairing
- Open
/data#reconciliationand press Declare pairing. - Fill in both sides, the partition and timestamp columns, the scales, the settle window and the cadence, then press Create proposed pairing. The new pairing opens in the detail panel with status Proposed.
- If any field is still empty, fill it under Complete / edit proposal and press Save changes.
- Press Activate and confirm. If an error appears, read Index check and the message, fix the cause, and try again.
- After the next check, read the Partitions table and the open finding count.
Review a proposal made by mmune
- Select a pairing whose row reads "proposed by mmune".
- Check the Spec against your own understanding of the two tables.
- Complete any missing fields and press Save changes, then Activate. Press Reject if the pairing does not make sense.
Stop comparing temporarily
- Select an Active pairing and press Pause.
- Press Activate when you want checks to resume.
API equivalent.
| Action | Method and path |
|---|---|
List pairings (optional status) | GET /api/v1/reconciliation/pairings |
| One pairing with its partitions | GET /api/v1/reconciliation/pairings/{pairing_id} |
| Declare a pairing (HTTP 201, status Proposed) | POST /api/v1/reconciliation/pairings |
| Edit a Proposed or Paused pairing | PATCH /api/v1/reconciliation/pairings/{pairing_id} |
| Activate, pause, reject | POST /api/v1/reconciliation/pairings/{pairing_id}/activate, /pause, /reject |
Findings (optional pairing_id, include_resolved, limit 1 to 500, default 100) | GET /api/v1/reconciliation/findings |
Reads need a signed-in user. Declare, edit, activate, pause and reject need the write permission. Editing a pairing that is Active or Rejected returns HTTP 409 with code pairing_not_editable, and a change the status rules do not allow returns HTTP 409 with code illegal_transition. The activate call ignores any extra body fields, so there is no way to override the index check from the API.