Appearance
Dashboard
What this page covers: the Dashboard at route /, which gives you one screen with the overall system health score, the open issues that need attention, a summary of your connected estate, and a shortcut to the Passive Audit Report.
Prerequisites / permissions: you must be signed in to the mmune web UI with a role that has the read permission. Dismissing a finding needs the write permission. Nothing on this page needs an administrator role.
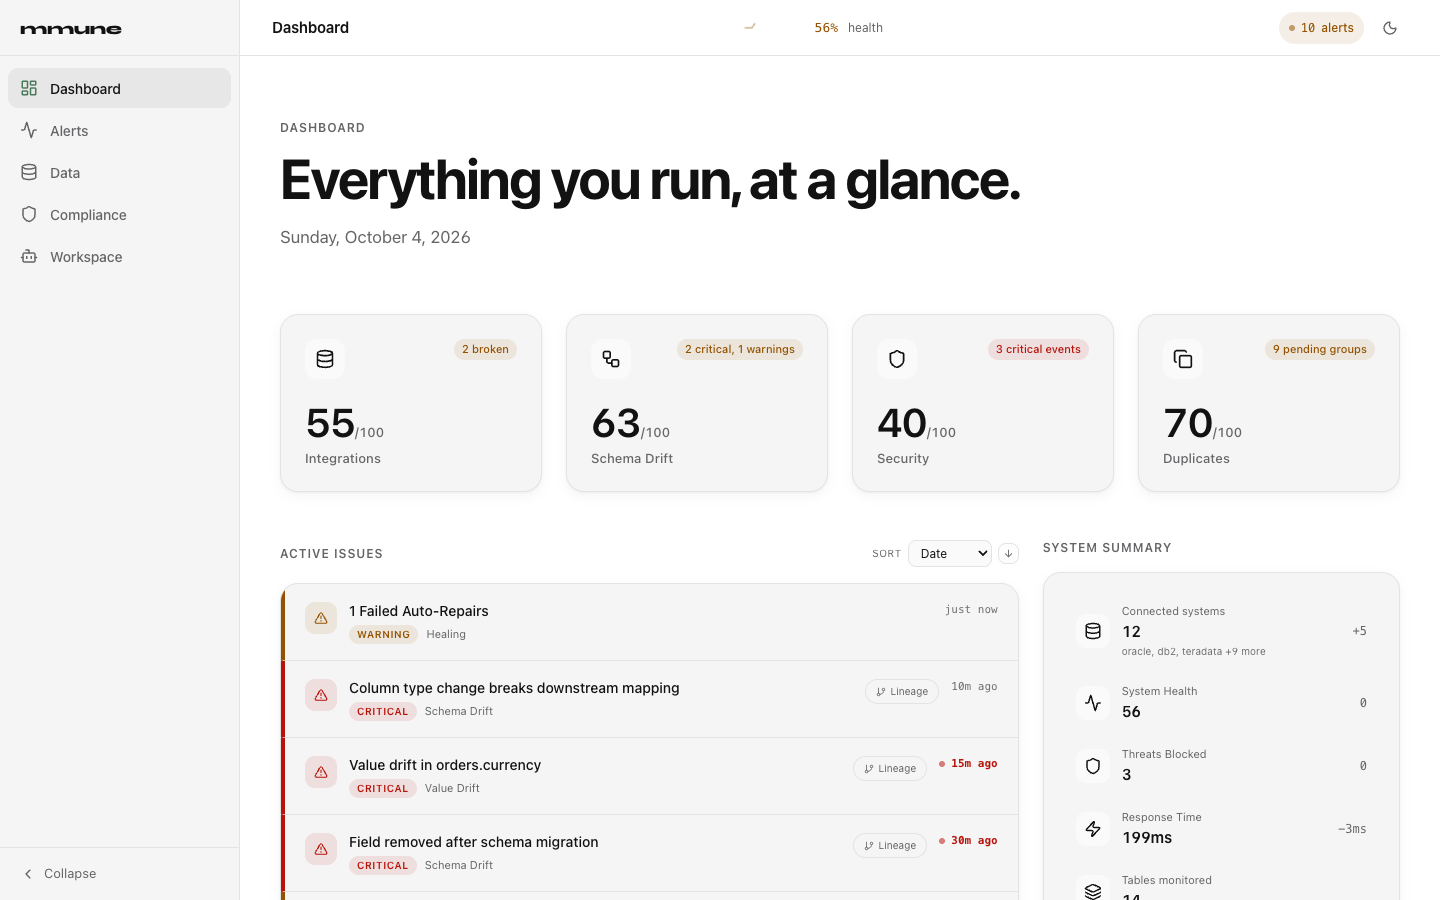
Screenshots show sample data. Your numbers, integration names and timestamps will differ.
Open the Dashboard
Select Dashboard in the left sidebar, or go to /. The older path /dashboard redirects here. The top bar shows the name of the current page on the left, the system health indicator in the middle, and the alert count pill on the right. Both of those top bar items are explained in Alerts.
The four health score tiles
The row of four tiles under the page title breaks the overall health score into its parts. Each tile shows a score out of 100, a short label, and a coloured chip. While the first reading loads, the tiles show placeholder skeletons.
| Tile | What it measures | Label examples |
|---|---|---|
| Integrations | Broken and degraded connections among your registered integrations | All connected, 2 broken, 2 broken, 1 degraded |
| Schema Drift | Open schema drift alerts, weighted by severity | No alerts, 2 critical, 1 warnings |
| Security | Security threats that Guardian currently reports | All clear, 3 critical events |
| Duplicates | Duplicate record groups that are still unresolved | No pending groups, 9 pending groups |
The chip colour follows the status of that dimension. Green means healthy, which requires that the dimension has no issues at all. Amber means degraded, which means the dimension has at least one issue and its score is 50 or higher. Red means critical, which means at least one issue and a score below 50. A dimension with any active issue never shows as healthy, even when the score only dropped by a point or two.
How the overall System Health score is calculated
The overall score is a weighted sum of the four tile scores, rounded to a whole number. The web UI computes it from live data. No API endpoint returns the score itself.
| Dimension | Weight | Deduction from 100 |
|---|---|---|
| Integrations | 40% | 22 for the first broken integration, 18 for the second, 12 for the third and each one after that, plus 7 per degraded integration. Scaled by the square root of 15 divided by your number of registered integrations. |
| Schema Drift | 30% | 15 per critical drift alert and 5 per warning, scaled by the square root of the same scale factor. |
| Security | 20% | 20 per critical event and 8 per warning. Not scaled. The tile counts Guardian threats, weighted as critical. |
| Duplicates | 10% | 3 per pending duplicate group, scaled, capped at 100. |
Each dimension score is floored at 0. If you have no registered integrations, the scale factor uses a reference size of 15.
There is also a cap. If the number of broken integrations is greater than the larger of 2 and 13% of your total integrations (rounded down), the overall score cannot exceed 40, whatever the other dimensions say. When this cap is active, the hover breakdown on the System Health row shows "Capped" and the top bar popover shows "Critical failure threshold exceeded".
The colour of the score in the top bar is green at 80 and above, amber from 50 to 79, and red below 50.
API equivalent: the score inputs come from
GET /api/v1/healing/broken-connections,GET /api/v1/integrations/discovered(registered rows only),GET /api/v1/drift/reports?limit=100,GET /api/v1/monitoring/dataandPOST /api/v1/duplicates/detectwith the body{"records": []}. See Health and monitoring API and Integrations and discovery API for the first four calls, and Mapping, lineage and semantic API for the duplicates call.
Active Issues
The Active Issues card lists at most six rows. It merges two sources: registered integrations that report a status of error or broken, and the unified alert feed that also powers the Alert Center (schema drift, value drift, healing, Guardian and reconciliation findings).
Use the Sort control at the top right of the card to switch between Date and Severity, and the arrow button next to it to flip ascending or descending. The default is Date, newest first. When sorting by severity, broken connections rank as the most severe, so they come first when the arrow is set to ascending and last when it is set to descending. The arrow starts on descending, so after switching to Severity you will usually need to flip it to see the most severe rows first.
Each row shows an icon, a title, a severity pill (critical, warning or info), the source of the issue, and its age. Broken connection rows show no age. They show the integration name, a critical pill, the label Broken Connection, the provider and a Network Map label instead. Click a row to act on it.
| Row type | What a click does |
|---|---|
| Broken Connection (always critical, shows the integration name and provider) | Opens the Network Map at /data?tab=network |
| Any alert | Opens the Alert Center at /alerts with that alert's detail window already open |
Rows that can be traced to a lineage node also show a Lineage button. It opens /data?tab=lineage focused on the affected integration, table and field.
The age text turns coloured and a small pulsing dot appears when an issue has stayed open longer than expected for its severity. The thresholds are 15 minutes for critical, 2 hours for warning and 24 hours for info. Red bold text marks a stale critical issue and amber marks the others.
If there is nothing to show, the card reads "No active issues". The View all alerts link at the bottom of the card goes to /alerts.
The Active Issues card shows at most six rows. Open Alerts for the full list.
API equivalent: the alert rows are assembled from
GET /api/v1/drift/reports?limit=100,GET /api/v1/drift/value-drift,GET /api/v1/healing/statistics,GET /api/v1/guardian/scan/statusandGET /api/v1/reconciliation/findings. See Health and monitoring API for the drift and healing calls, Security and platform API for the Guardian status call, and Mapping, lineage and semantic API for reconciliation findings.
System Summary
The System Summary card, on the right of Active Issues, lists six figures. Some rows are clickable.
| Row | What it shows | Click or hover |
|---|---|---|
| Connected systems | Count of registered integrations, with the provider names underneath (up to three names, then "+N more") | Opens /data?tab=network |
| System Health | The overall score from the section above | Hover to see "What makes up N", the four dimensions with their weights and scores |
| Threats Blocked | Number of security threats Guardian currently reports | None |
| Response Time | Average health check duration across mmune's own agents, in milliseconds. Shows a dash if no agent has reported. | None |
| Tables monitored | Count of discovered schemas from discovery | Opens /data?tab=integrations |
| Drift caught (7d) | Number of drift alerts with a timestamp in the last seven days | Opens /data?tab=lineage |
Threats Blocked counts security threats detected. mmune does not modify your systems.
The small number on the right of a row is a change indicator. For System Health and Threats Blocked it is the difference since you opened the page. For Response Time it is the difference from the previous reading, which arrives every two seconds. The change figure on Connected systems is informational.
API equivalent:
GET /api/v1/monitoring/data(response time, threats),GET /api/v1/integrations/discovered(connected systems),GET /api/v1/discovery/schemas(tables monitored) andGET /api/v1/drift/reports?limit=100(drift caught). See Health and monitoring API.
What mmune found in your estate
This card shows up to five of the highest-ranked findings that mmune produced about your estate after discovery and introspection. Ranking is by severity first, then blast radius (how many things sit downstream), then recency. Each finding has a severity icon and pill (critical, warning or info), a plain-language statement, and the integration it concerns.
Click a finding to go to the most relevant page. Findings about unmasked personal data go to /compliance. Findings tied to a specific table or object open /data?tab=lineage focused on that node. Findings about integrations that need a connector, need credentials or failed a connection test go to /data?tab=integrations.
To dismiss a finding, click the X on its row. The finding disappears at once and is removed from the ranked list for everyone. If the request fails, the list reloads and the finding comes back. Dismissing needs the write permission.
If no findings exist yet, the card explains why. With no discovered integrations it says "mmune hasn't discovered any integrations yet." Otherwise it reports how many integrations and tables mmune has learned so far. View all findings opens /data?tab=findings.
API equivalent:
GET /api/v1/discovery/first-findings?limit=5to list, andPOST /api/v1/discovery/first-findings/{id}/dismissto dismiss. See Integrations and discovery API.
Top recommendations
The Top recommendations card shows the three most severe active recommendations from the Estate Advisor, ordered critical, high, medium, then low. Each row shows the title, a severity pill, the provider if there is one, and a dollar figure when the recommendation carries a cost estimate. Click a row, or the Open Estate Advisor link, to go to /data?tab=recommendations. With nothing active, the card reads "No active recommendations yet. Estate Advisor will surface findings after the next scan."
API equivalent:
GET /api/v1/recommendations?status=active. See Mapping, lineage and semantic API.
Reports shortcut
The Reports section at the bottom holds one card, Passive Audit Report. Clicking it opens /compliance?focus=passive-audit-report, which scrolls the Compliance page to the report generator. The steps for generating the report are in Compliance.
How often the Dashboard refreshes
The page refreshes itself without a reload. The following table shows what is polled and how often.
| Data | Interval |
|---|---|
| Monitoring data (response time, threats) | 2 seconds |
| Health score inputs | 6 seconds |
| Alerts and registered integrations | 30 seconds |
| Tables monitored and drift caught | 60 seconds |
| First findings and recommendations | Once, when the page opens |
Common tasks
Find out why the health score dropped
Hover over the System Health row in the System Summary card, or click the health indicator in the top bar. The hover tooltip shows each dimension with its numeric score. The top bar popover shows the overall score and, for each dimension, a status icon and a short summary such as "2 broken", but no number per dimension. In either place, the dimension with the red or amber chip or the worst summary is the cause. In the top bar popover, an arrow button next to a dimension with issues jumps to the right page: Integrations to /data, Schema Drift to /alerts, Compliance to /compliance, and Duplicates to /data#duplicates.
See which integration is broken
Open Alerts. Broken connections appear there as Healing events titled "<integration> requires healing". The Network Map at /data?tab=network shows the same connections as a graph.
Dismiss a finding that does not apply
Click the X on the row in the "What mmune found in your estate" card. See the section above for what that does.
Hand a snapshot to a security or compliance reviewer
Click the Passive Audit Report card and follow Generate the Passive Audit Report.
Related pages
Alerts covers the full event feed and incidents. Compliance covers Guardian, frameworks and the license. The API overview explains authentication and the request conventions used by every endpoint named above.